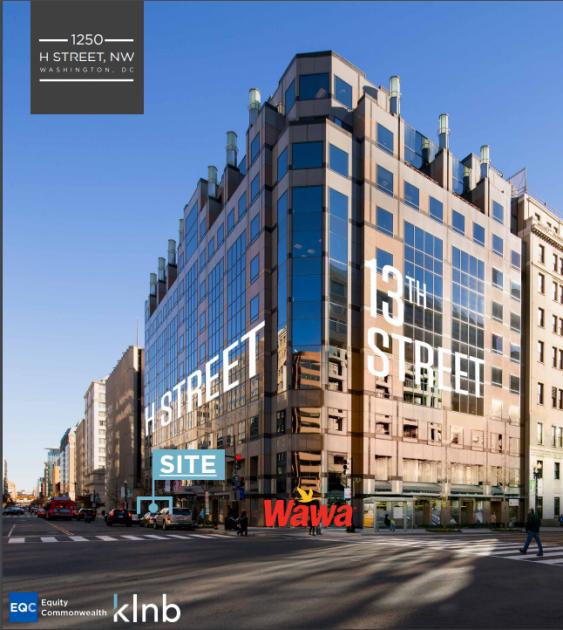
2,684 SF retail for lease in Metro Center
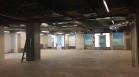
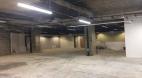
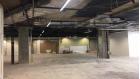
One column - majority open space
11’ - 8 1/2” ceiling height
Type II vented food uses considered
Frontage on H Street, NW
1/2 block from Metro Center Metro Station (27,058 average weekday ridership)
197,070 SF Class A office building, 90% leased
106,769 employees within a 10 minute walk
Join Staples, Macy’s, and Metro Center Marriott
No part of this information may be copied, reproduced, repurposed, or screen-captured for any commercial purpose without prior written authorization from MyEListing.
While we strive to provide the most accurate information, all listing information, and demographic data, is provided by third-parties. As such, MyEListing will not be responsible for the accuracy of the information. It is strongly recommended that you verify all information with the listing agent, and any relevant agencies, prior to making any decisions.
What is the building size of this commercial Retail property?
The size of this lease property at '.1250 H Street Northwest.' is 2684 square feet
What kind of Retail is the propery at 1250 H Street Northwest?
The property at 1250 H Street Northwest Washington, DC 20005 is listed as a Shopping Center Retail property
What is the population within 1 mile of 1250 H Street Northwest in Washington?
The population within 1 mile of 1250 H Street Northwest Washington, DC 20005 is 49,062 people.
Who do I contact for questions about 1250 H Street Northwest?
You should contact the listing agent,
Kim Stein, for any details regarding this commercial listing.