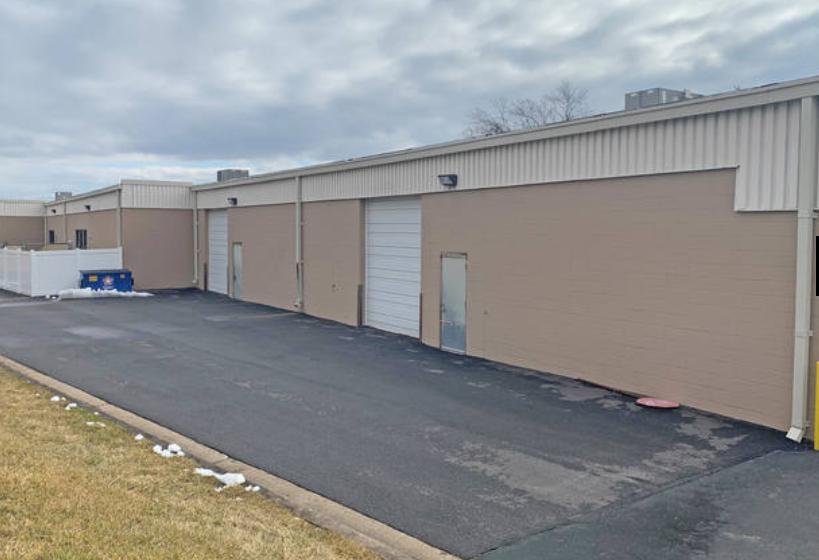
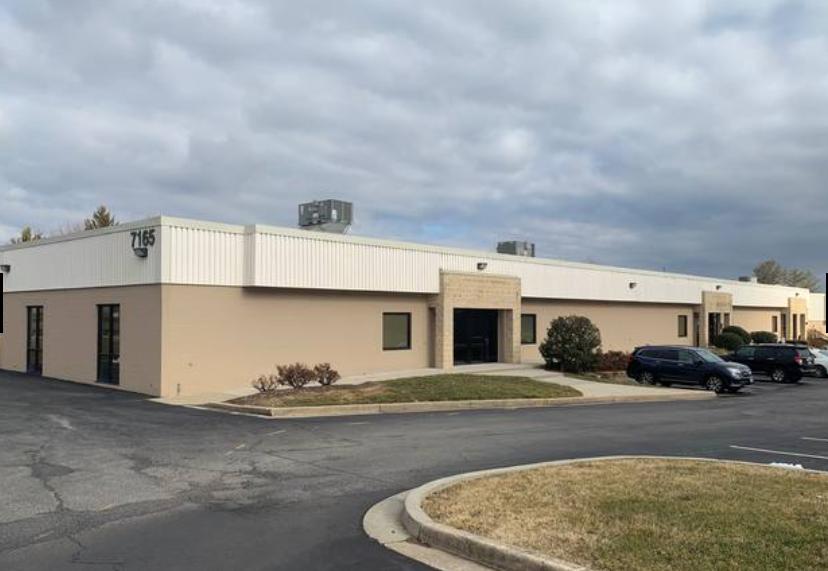
1-Mile | 3-Miles | 5-Miles | ||
---|---|---|---|---|
Total Population | 5,557 | 75,979 | 211,546 | |
Population Median Age | 39 | 37 | 37 | |
Population by Age | 0-9 Yrs | 640 (11%) | 9775 (12%) | 27090 (12%) |
10-19 Yrs | 597 (10%) | 9557 (12%) | 26411 (12%) | |
20-29 Yrs | 820 (14%) | 10270 (13%) | 29292 (13%) | |
30-39 Yrs | 890 (16%) | 12393 (16%) | 33765 (15%) | |
40-49 Yrs | 687 (12%) | 10716 (14%) | 30477 (14%) | |
50-59 Yrs | 753 (13%) | 9281 (12%) | 28350 (13%) | |
60-69 Yrs | 667 (12%) | 7734 (10%) | 20073 (9%) | |
70+ Yrs | 502 (9%) | 6253 (8%) | 16089 (7%) | |
Median HH Income | $112,491 | $107,501 | $110,941 | |
Total Household Income | < 24K | 183 (8%) | 2733 (9%) | 6423 (8%) |
25-49K | 166 (7%) | 2459 (8%) | 6952 (9%) | |
50-74K | 245 (11%) | 3668 (12%) | 9410 (12%) | |
75-99K | 299 (13%) | 4195 (14%) | 10993 (14%) | |
100-199K | 1011 (46%) | 11202 (39%) | 29105 (38%) | |
200K+ | 291 (13%) | 4343 (15%) | 13391 (17%) | |
Highest Education Level | No Diploma | 93 | 3075 | 8895 |
Diploma or GED | 661 | 7663 | 22292 | |
Some College | 637 | 8337 | 22835 | |
Assoc. Degree | 195 | 3030 | 8674 | |
Bachelors Degree | 1255 | 15168 | 42318 | |
Higher Degree | 1031 | 14561 | 39746 | |
Total Housing Units | 2,336 | 30,037 | 80,201 | |
--Owner-Occupied | 1,566 | 19,578 | 51,429 | |
--Renter-Occupied | 630 | 9,022 | 24,846 | |
Owner-Occupied Values | < 100K | 29 | 863 | 1791 |
100-199K | 28 | 1126 | 2747 | |
200-299K | 518 | 4218 | 9481 | |
300-399K | 720 | 6618 | 15777 | |
400-499K | 203 | 4303 | 10106 | |
500K+ | 67 | 2449 | 11527 | |
Total Working Age Population | 4,573 | 60,510 | 168,017 | |
In Work Force | 3,375 | 44,328 | 119,555 | |
Not In Work Force | 1,198 | 16,182 | 48,462 | |
Workforce Employed | 3,241 | 41,949 | 112,990 | |
Workforce Unemployed | 96 | 1,787 | 4,672 | |
Civlian Workforce | 3,337 | 43,736 | 117,662 | |
Military Workforce | 38 | 592 | 1,893 | |
Total Households | 2,195 | 28,600 | 76,274 | |
Family Households | 1,308 | 19,104 | 52,273 | |
Non-Family Households | 887 | 9,497 | 24,002 | |
Married Couple | 967 | 14,552 | 39,330 | |
Other Family | 342 | 4,552 | 12,942 | |
Married w/Child | 456 | 6,945 | 18,664 | |
Single Male w/Child | 37 | 428 | 1,344 | |
Single Female w/Child | 135 | 1,840 | 5,283 |
Population Change Last Two Decades - Plus Projection
2000 | % | 2010 | % | 2020 | % | 2030 | |
---|---|---|---|---|---|---|---|
Maryland | 5,296,486 | +9 | 5,773,552 | +6 | 6,141,900 | +6 | 6,518,750 |
Anne Arundel County | 489,656 | +10 | 537,656 | +7 | 573,250 | +4 | 596,700 |
Baltimore County | 754,292 | +7 | 805,029 | +5 | 847,000 | +2 | 862,200 |
Howard County | 247,842 | +16 | 287,085 | +17 | 336,900 | +9 | 366,800 |
Montgomery County | 873,341 | +11 | 971,777 | +8 | 1,052,050 | +7 | 1,128,800 |
Prince Georges County | 801,515 | +8 | 863,420 | +6 | 916,150 | +4 | 952,950 |
Total Working Age Population:
Total Households:
Total Working Age Population:
Total Households:
Total Working Age Population:
Total Households: