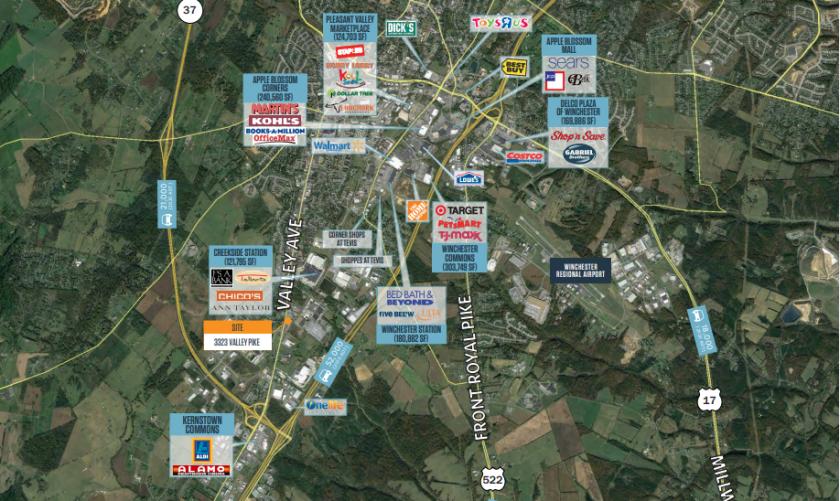
1-Mile | 3-Miles | 5-Miles | ||
---|---|---|---|---|
Total Population | 2,237 | 25,475 | 67,636 | |
Population Median Age | 42 | 39 | 38 | |
Population by Age | 0-9 Yrs | 216 (9%) | 3138 (12%) | 8943 (13%) |
10-19 Yrs | 286 (12%) | 3279 (12%) | 9246 (13%) | |
20-29 Yrs | 275 (12%) | 3589 (14%) | 8838 (13%) | |
30-39 Yrs | 235 (10%) | 3085 (12%) | 8235 (12%) | |
40-49 Yrs | 295 (13%) | 3141 (12%) | 8735 (12%) | |
50-59 Yrs | 417 (18%) | 3575 (14%) | 9178 (13%) | |
60-69 Yrs | 193 (8%) | 2657 (10%) | 7297 (10%) | |
70+ Yrs | 320 (14%) | 3012 (11%) | 7163 (10%) | |
Median HH Income | $76,673 | $68,465 | $68,613 | |
Total Household Income | < 24K | 95 (11%) | 1455 (14%) | 3421 (13%) |
25-49K | 183 (21%) | 1885 (19%) | 5275 (21%) | |
50-74K | 136 (15%) | 2054 (20%) | 5050 (20%) | |
75-99K | 186 (21%) | 1333 (13%) | 3590 (14%) | |
100-199K | 168 (19%) | 2523 (25%) | 6189 (24%) | |
200K+ | 84 (9%) | 588 (5%) | 1526 (6%) | |
Highest Education Level | No Diploma | 238 | 1920 | 5669 |
Diploma or GED | 360 | 4660 | 12649 | |
Some College | 255 | 3510 | 8715 | |
Assoc. Degree | 187 | 1372 | 3494 | |
Bachelors Degree | 282 | 3331 | 8389 | |
Higher Degree | 255 | 2436 | 6297 | |
Total Housing Units | 893 | 10,593 | 27,202 | |
--Owner-Occupied | 563 | 6,056 | 15,257 | |
--Renter-Occupied | 289 | 3,781 | 9,793 | |
Owner-Occupied Values | < 100K | 13 | 168 | 624 |
100-199K | 118 | 1381 | 3983 | |
200-299K | 225 | 2458 | 5439 | |
300-399K | 113 | 1418 | 3265 | |
400-499K | 44 | 270 | 968 | |
500K+ | 49 | 361 | 977 | |
Total Working Age Population | 1,868 | 20,585 | 53,502 | |
In Work Force | 1,153 | 13,231 | 35,193 | |
Not In Work Force | 715 | 7,354 | 18,309 | |
Workforce Employed | 1,101 | 12,745 | 34,034 | |
Workforce Unemployed | 52 | 448 | 1,115 | |
Civlian Workforce | 1,153 | 13,193 | 35,149 | |
Military Workforce | 0 | 39 | 44 | |
Total Households | 852 | 9,838 | 25,050 | |
Family Households | 574 | 6,253 | 16,734 | |
Non-Family Households | 278 | 3,585 | 8,315 | |
Married Couple | 379 | 4,692 | 12,189 | |
Other Family | 195 | 1,561 | 4,545 | |
Married w/Child | 80 | 1,721 | 4,783 | |
Single Male w/Child | 34 | 206 | 613 | |
Single Female w/Child | 60 | 629 | 1,815 |
Population Change Last Two Decades - Plus Projection
2000 | % | 2010 | % | 2020 | % | 2030 | |
---|---|---|---|---|---|---|---|
Virginia | 7,078,515 | +13 | 8,001,024 | +8 | 8,655,021 | +8 | 9,331,666 |
Clarke County | 12,652 | +11 | 14,034 | +3 | 14,509 | +5 | 15,279 |
Frederick County | 59,209 | +32 | 78,305 | +15 | 90,115 | +16 | 104,608 |
Winchester city | 23,585 | +11 | 26,203 | +10 | 28,804 | +8 | 31,005 |
Total Working Age Population:
Total Households:
Total Working Age Population:
Total Households:
Total Working Age Population:
Total Households: