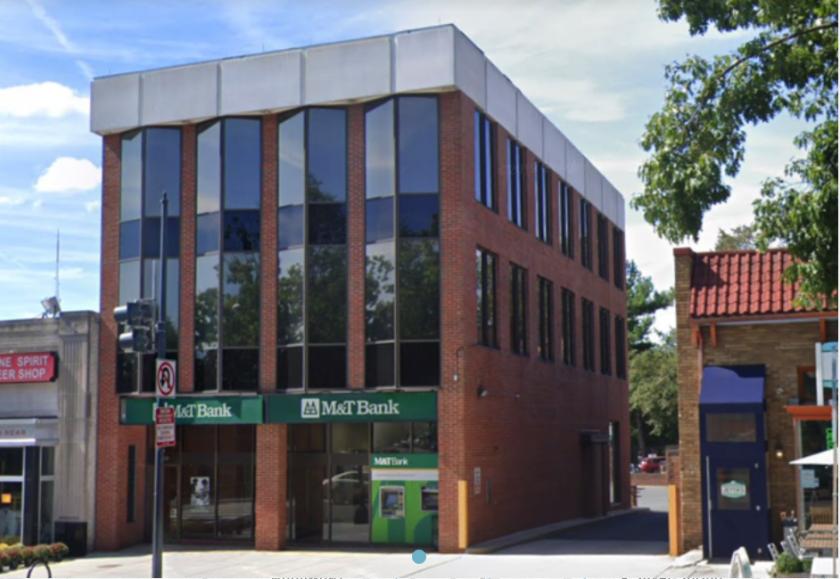
Office Space
5630 Connecticut Avenue Northwest Washington, DC 20015
5630 Connecticut Avenue Northwest Washington, DC 20015
Details & Description
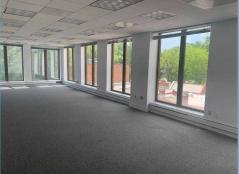
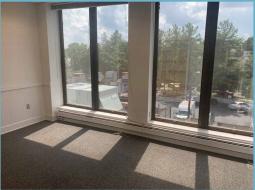
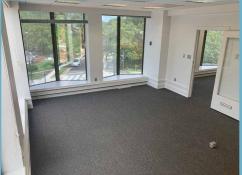
Additional Photos

Listing Agents

Harry Dematatis
O: 202-420-7778
M: 202-246-3082
hdematatis@klnb.com
O: 202-420-7778
M: 202-246-3082
hdematatis@klnb.com

Andrew Courembis
O: 202-420-7766
M: 301-904-8667
acourembis@klnb.com
O: 202-420-7766
M: 301-904-8667
acourembis@klnb.com
While we strive to provide the most accurate information, all listing information, and demographic data, is provided by third-parties. As such, MyEListing will not be responsible for the accuracy of the information. It is strongly recommended that you verify all information with the listing agent, and any relevant agencies, prior to making any decisions.


