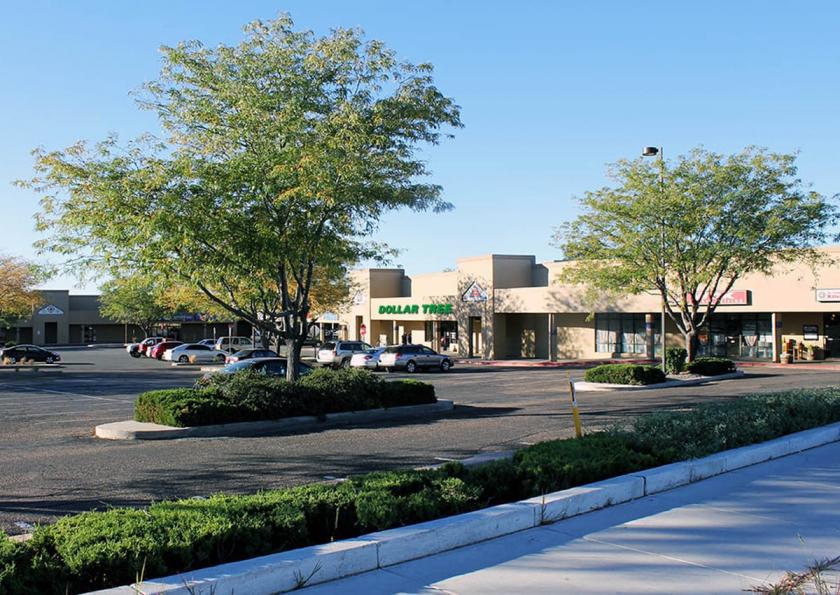
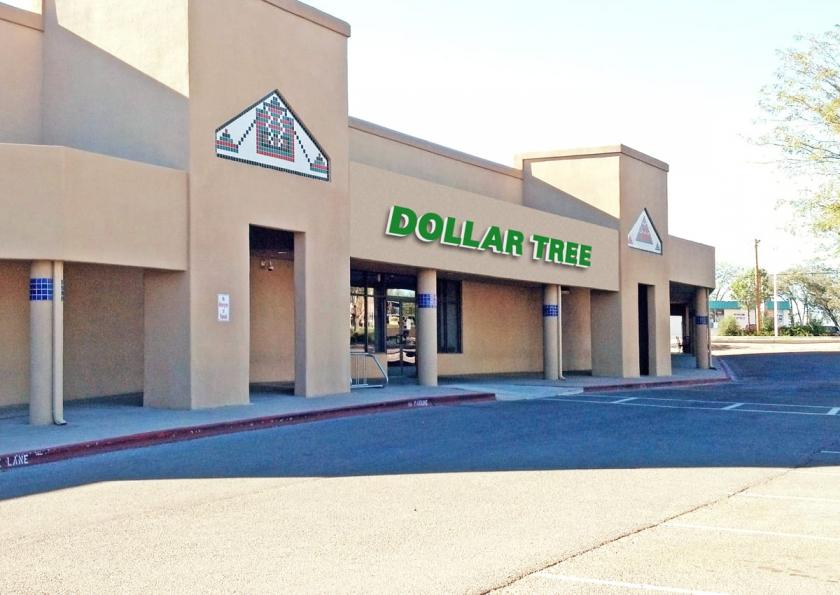
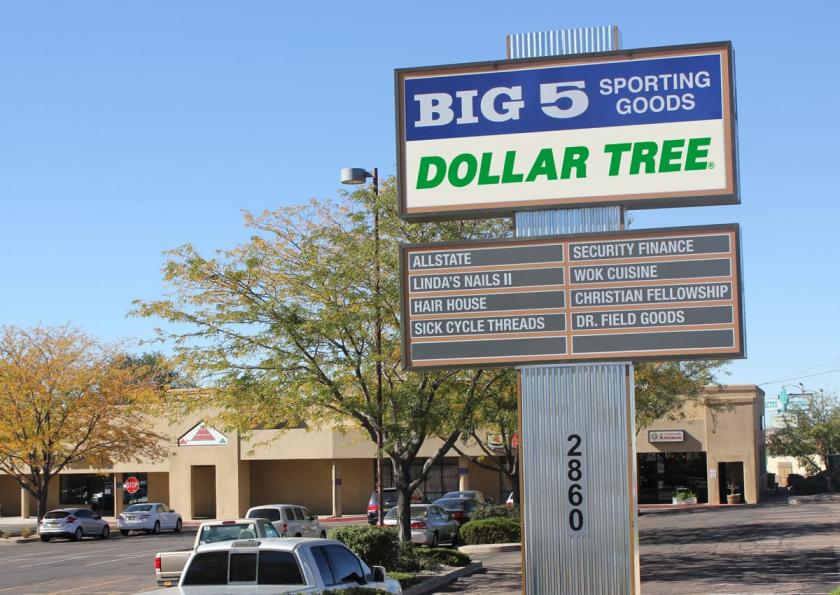
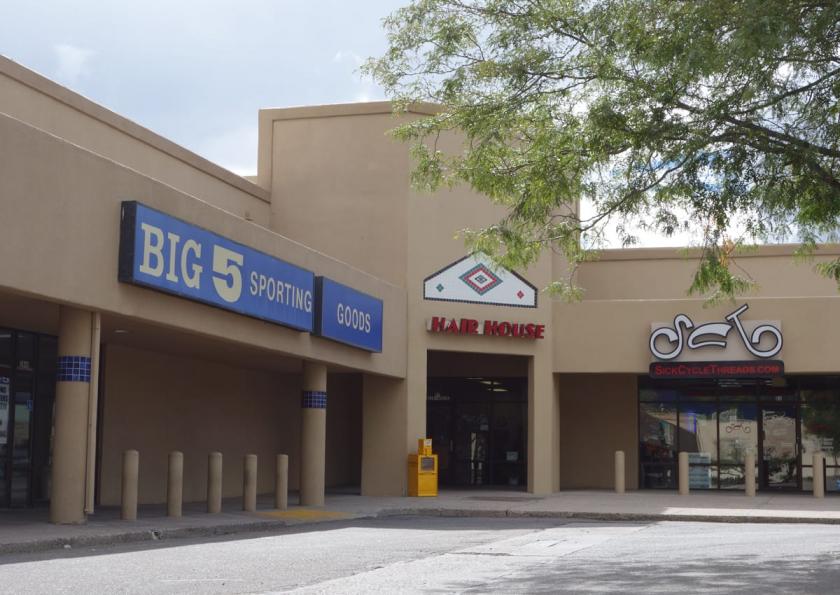
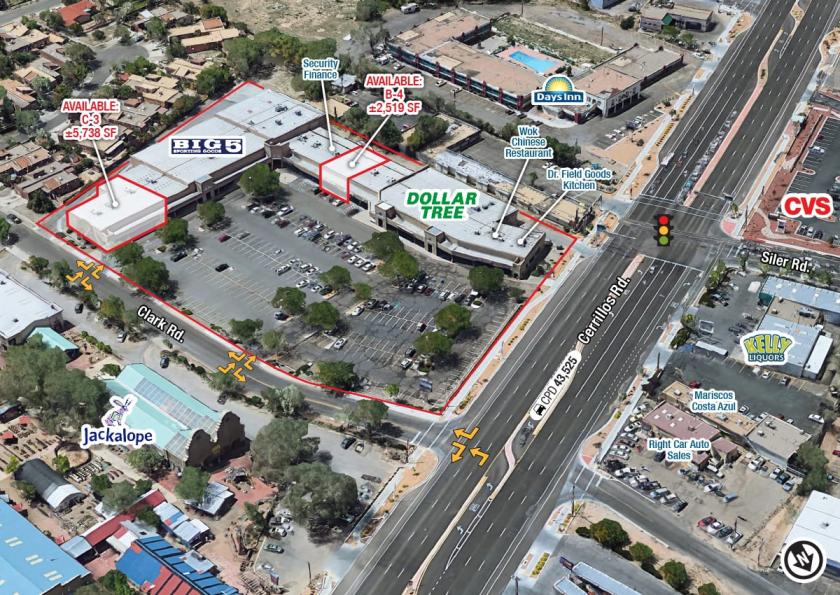
1-Mile | 3-Miles | 5-Miles | ||
---|---|---|---|---|
Total Population | 10,272 | 55,292 | 88,053 | |
Population Median Age | 41 | 42 | 43 | |
Population by Age | 0-9 Yrs | 980 (9%) | 5480 (9%) | 8728 (9%) |
10-19 Yrs | 1257 (12%) | 6269 (11%) | 9934 (11%) | |
20-29 Yrs | 1226 (11%) | 6522 (11%) | 10138 (11%) | |
30-39 Yrs | 1524 (14%) | 7349 (13%) | 11146 (12%) | |
40-49 Yrs | 1353 (13%) | 7037 (12%) | 10773 (12%) | |
50-59 Yrs | 1469 (14%) | 7275 (13%) | 11694 (13%) | |
60-69 Yrs | 1186 (11%) | 7815 (14%) | 12970 (14%) | |
70+ Yrs | 1276 (12%) | 7545 (13%) | 12669 (14%) | |
Median HH Income | $51,924 | $53,366 | $58,424 | |
Total Household Income | < 24K | 834 (19%) | 4902 (21%) | 6754 (18%) |
25-49K | 1162 (27%) | 6083 (26%) | 9141 (24%) | |
50-74K | 992 (23%) | 4386 (18%) | 7110 (19%) | |
75-99K | 482 (11%) | 3006 (12%) | 4520 (12%) | |
100-199K | 650 (15%) | 3991 (17%) | 7247 (19%) | |
200K+ | 87 (2%) | 963 (4%) | 2174 (5%) | |
Highest Education Level | No Diploma | 901 | 5524 | 7607 |
Diploma or GED | 2353 | 9599 | 14559 | |
Some College | 1608 | 7808 | 11735 | |
Assoc. Degree | 471 | 2281 | 3973 | |
Bachelors Degree | 1151 | 7963 | 13467 | |
Higher Degree | 954 | 7381 | 13264 | |
Total Housing Units | 4,476 | 26,029 | 43,024 | |
--Owner-Occupied | 2,734 | 14,075 | 23,502 | |
--Renter-Occupied | 1,474 | 9,257 | 13,443 | |
Owner-Occupied Values | < 100K | 254 | 1723 | 2723 |
100-199K | 729 | 2638 | 3778 | |
200-299K | 1237 | 4371 | 6411 | |
300-399K | 297 | 2577 | 3986 | |
400-499K | 142 | 1161 | 2008 | |
500K+ | 75 | 1604 | 4596 | |
Total Working Age Population | 8,640 | 46,318 | 73,652 | |
In Work Force | 5,344 | 28,654 | 45,273 | |
Not In Work Force | 3,296 | 17,665 | 28,380 | |
Workforce Employed | 5,172 | 27,382 | 43,397 | |
Workforce Unemployed | 172 | 1,254 | 1,841 | |
Civlian Workforce | 5,344 | 28,636 | 45,239 | |
Military Workforce | 0 | 18 | 34 | |
Total Households | 4,207 | 23,332 | 36,946 | |
Family Households | 2,381 | 12,438 | 20,612 | |
Non-Family Households | 1,826 | 10,894 | 16,334 | |
Married Couple | 1,493 | 8,257 | 13,829 | |
Other Family | 888 | 4,181 | 6,783 | |
Married w/Child | 566 | 2,789 | 4,271 | |
Single Male w/Child | 118 | 594 | 945 | |
Single Female w/Child | 248 | 1,605 | 2,663 |
Population Change Last Two Decades - Plus Projection
2000 | % | 2010 | % | 2020 | % | 2030 | |
---|---|---|---|---|---|---|---|
New Mexico | 1,819,046 | +13 | 2,059,179 | +6 | 2,187,183 | +6 | 2,308,475 |
Santa Fe County | 129,292 | +12 | 144,170 | +5 | 151,767 | +7 | 162,782 |
Total Working Age Population:
Total Households:
Total Working Age Population:
Total Households:
Total Working Age Population:
Total Households: