Industrial Properties
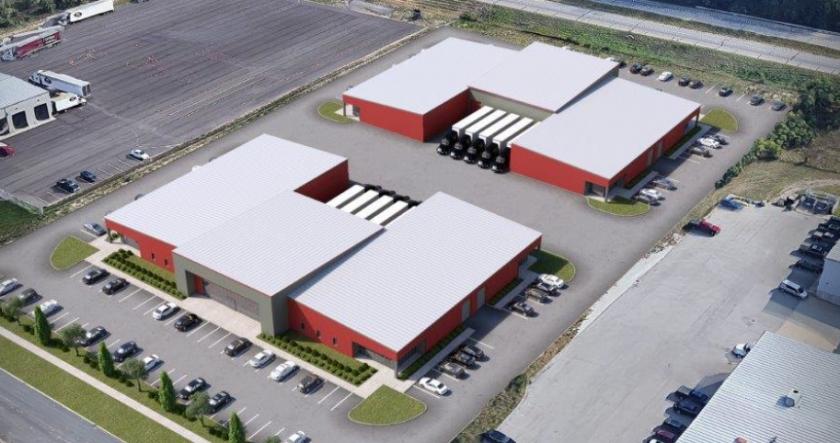
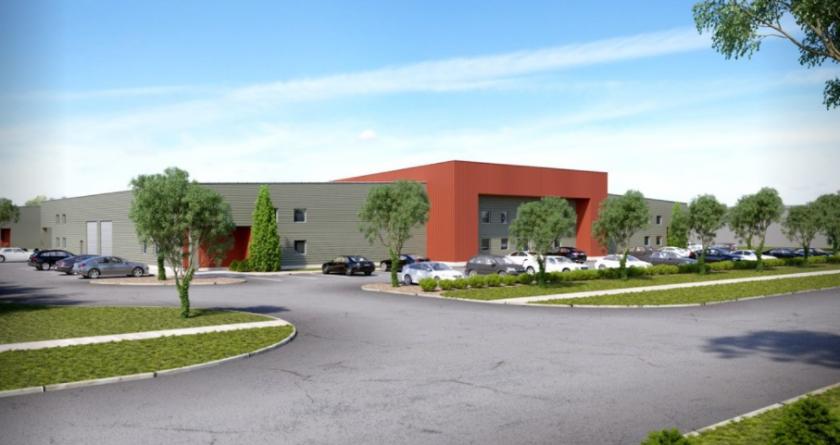
8970 Byron Commerce Drive Southwest Byron Center, MI 49315
8970 Byron Commerce Drive Southwest Byron Center, MI 49315
Details & Description
Listing Agents

Douglas Taatjes
O: 616-776-0100
M: 616-292-1828
dougt@naiwwm.com
O: 616-776-0100
M: 616-292-1828
dougt@naiwwm.com
While we strive to provide the most accurate information, all listing information, and demographic data, is provided by third-parties. As such, MyEListing will not be responsible for the accuracy of the information. It is strongly recommended that you verify all information with the listing agent, and any relevant agencies, prior to making any decisions.