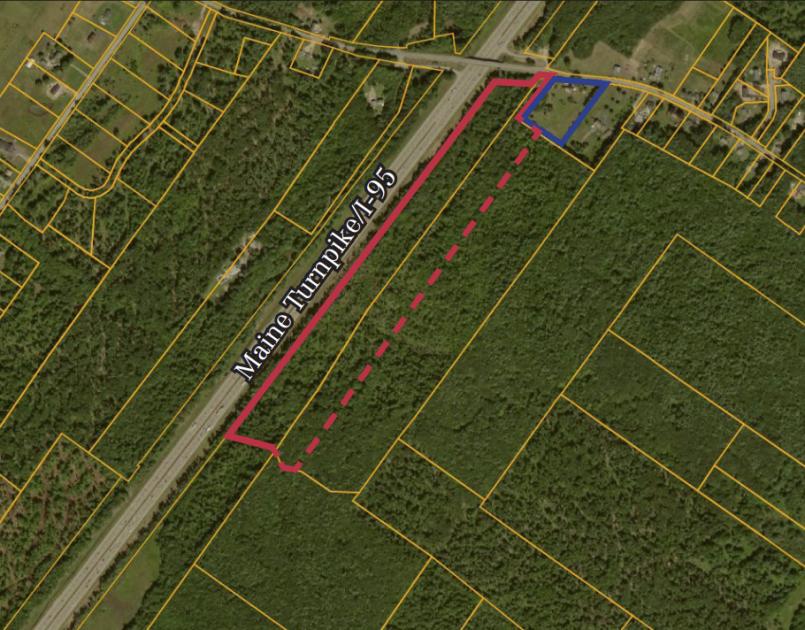
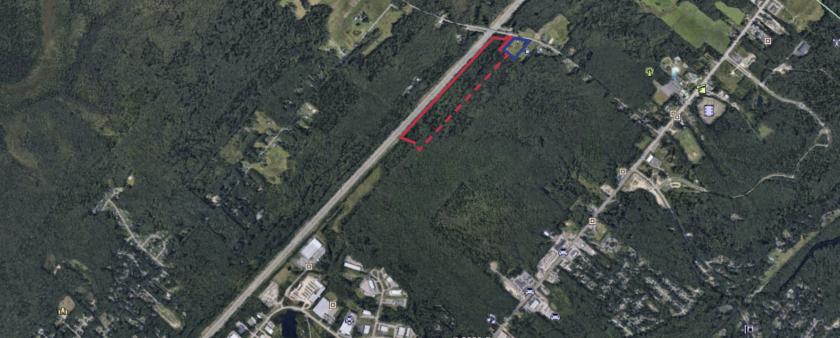
1-Mile | 3-Miles | 5-Miles | ||
---|---|---|---|---|
Total Population | 650 | 7,957 | 46,062 | |
Population Median Age | 37 | 42 | 42 | |
Population by Age | 0-9 Yrs | 98 (15%) | 832 (10%) | 4475 (9%) |
10-19 Yrs | 88 (13%) | 1012 (12%) | 4616 (10%) | |
20-29 Yrs | 72 (11%) | 716 (8%) | 7273 (15%) | |
30-39 Yrs | 68 (10%) | 843 (10%) | 4881 (10%) | |
40-49 Yrs | 111 (17%) | 1071 (13%) | 5788 (12%) | |
50-59 Yrs | 103 (15%) | 1486 (18%) | 7593 (16%) | |
60-69 Yrs | 60 (9%) | 1121 (14%) | 6271 (13%) | |
70+ Yrs | 49 (7%) | 876 (11%) | 5165 (11%) | |
Median HH Income | $98,414 | $77,030 | $65,862 | |
Total Household Income | < 24K | 10 (4%) | 381 (11%) | 3198 (16%) |
25-49K | 44 (18%) | 419 (13%) | 4014 (20%) | |
50-74K | 32 (13%) | 765 (23%) | 4273 (21%) | |
75-99K | 33 (14%) | 393 (12%) | 2618 (13%) | |
100-199K | 102 (43%) | 996 (31%) | 4421 (22%) | |
200K+ | 12 (5%) | 239 (7%) | 1340 (6%) | |
Highest Education Level | No Diploma | 28 | 289 | 2234 |
Diploma or GED | 118 | 1653 | 9741 | |
Some College | 96 | 1022 | 6283 | |
Assoc. Degree | 25 | 492 | 3150 | |
Bachelors Degree | 104 | 1599 | 8213 | |
Higher Degree | 55 | 720 | 3935 | |
Total Housing Units | 247 | 3,393 | 23,331 | |
--Owner-Occupied | 219 | 2,724 | 12,472 | |
--Renter-Occupied | 14 | 469 | 7,392 | |
Owner-Occupied Values | < 100K | 12 | 327 | 968 |
100-199K | 44 | 522 | 2721 | |
200-299K | 99 | 709 | 4050 | |
300-399K | 52 | 653 | 2491 | |
400-499K | 12 | 377 | 1337 | |
500K+ | 1 | 137 | 905 | |
Total Working Age Population | 475 | 6,442 | 38,858 | |
In Work Force | 361 | 4,464 | 27,120 | |
Not In Work Force | 115 | 1,977 | 11,738 | |
Workforce Employed | 360 | 4,404 | 26,124 | |
Workforce Unemployed | 1 | 60 | 921 | |
Civlian Workforce | 361 | 4,464 | 27,046 | |
Military Workforce | 0 | 0 | 74 | |
Total Households | 233 | 3,193 | 19,864 | |
Family Households | 163 | 2,200 | 12,139 | |
Non-Family Households | 70 | 993 | 7,726 | |
Married Couple | 146 | 1,874 | 8,986 | |
Other Family | 17 | 326 | 3,152 | |
Married w/Child | 75 | 695 | 2,995 | |
Single Male w/Child | 0 | 22 | 339 | |
Single Female w/Child | 10 | 144 | 1,302 |
Population Change Last Two Decades - Plus Projection
2000 | % | 2010 | % | 2020 | % | 2030 | |
---|---|---|---|---|---|---|---|
Maine | 1,274,923 | +4 | 1,328,361 | +1 | 1,335,260 | 0 | 1,341,046 |
Cumberland County | 265,612 | +6 | 281,674 | +5 | 294,711 | +2 | 301,376 |
York County | 186,742 | +6 | 197,131 | +6 | 208,062 | +5 | 217,689 |
Total Working Age Population:
Total Households:
Total Working Age Population:
Total Households:
Total Working Age Population:
Total Households: