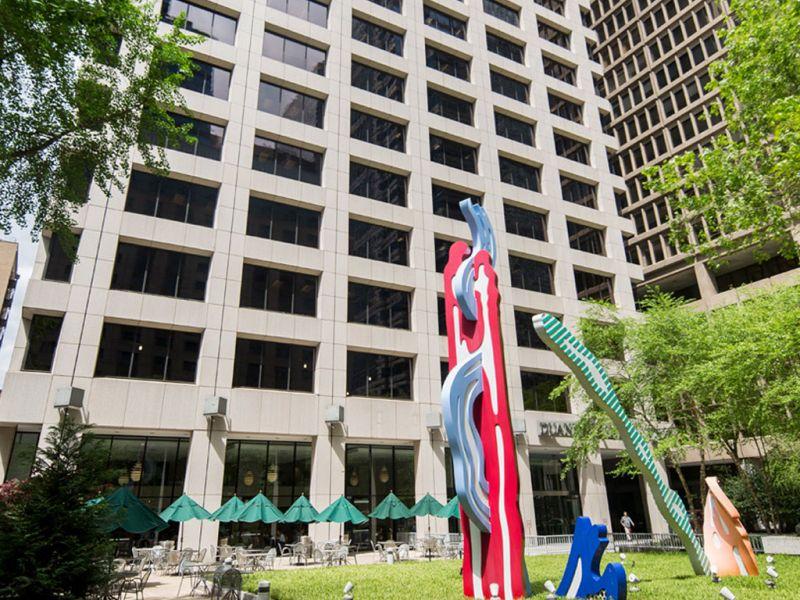
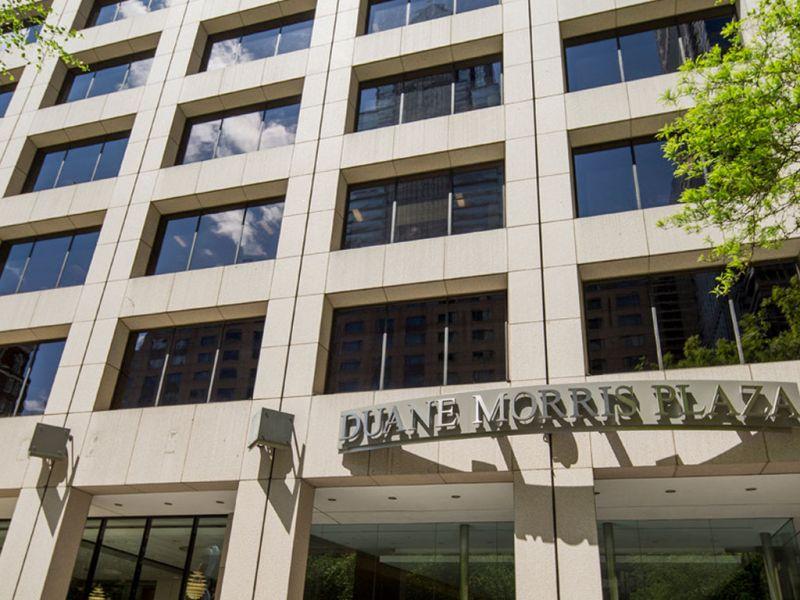
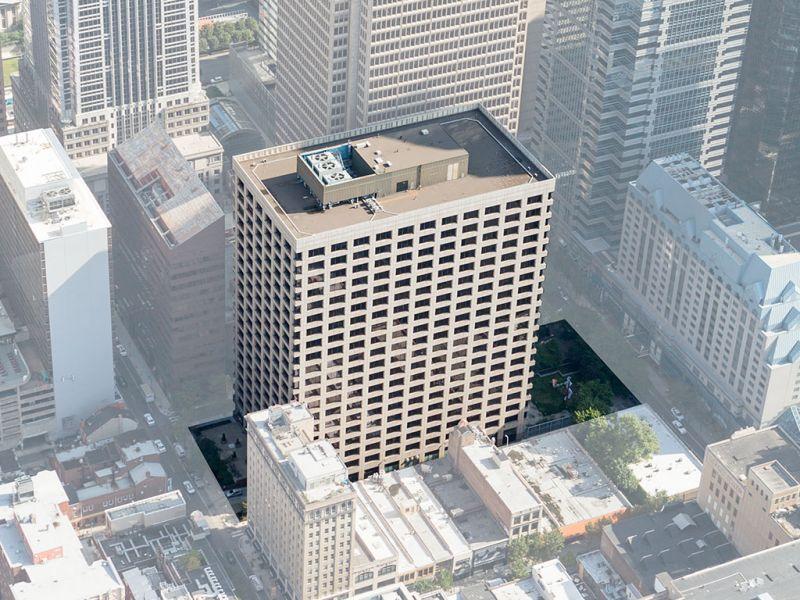
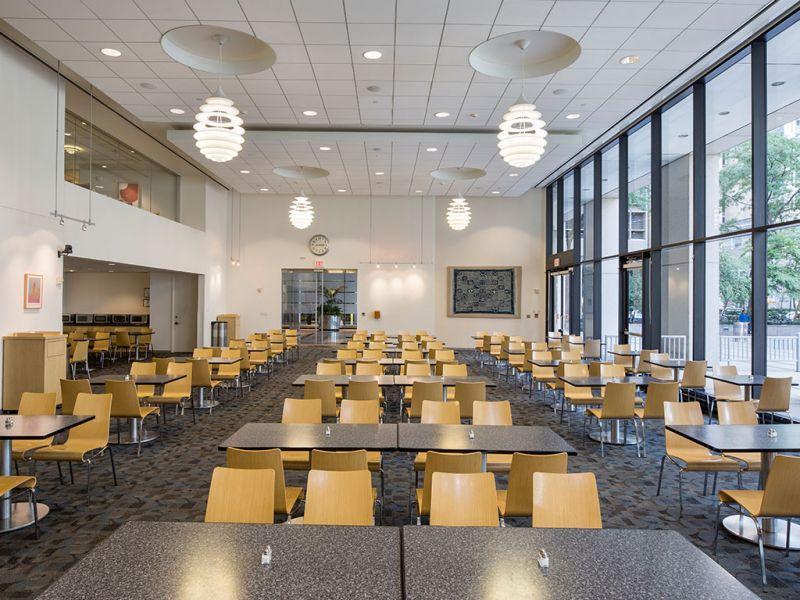
1-Mile | 3-Miles | 5-Miles | ||
---|---|---|---|---|
Total Population | 84,308 | 482,367 | 943,609 | |
Population Median Age | 39 | 36 | 36 | |
Population by Age | 0-9 Yrs | 4670 (5%) | 48009 (9%) | 116642 (12%) |
10-19 Yrs | 3827 (4%) | 51330 (10%) | 116502 (12%) | |
20-29 Yrs | 25020 (29%) | 111842 (23%) | 183989 (19%) | |
30-39 Yrs | 19463 (23%) | 90514 (18%) | 154107 (16%) | |
40-49 Yrs | 7952 (9%) | 48103 (9%) | 100862 (10%) | |
50-59 Yrs | 7805 (9%) | 49638 (10%) | 105752 (11%) | |
60-69 Yrs | 7315 (8%) | 43869 (9%) | 89010 (9%) | |
70+ Yrs | 8256 (9%) | 39064 (8%) | 76745 (8%) | |
Median HH Income | $81,505 | $53,760 | $42,407 | |
Total Household Income | < 24K | 8035 (17%) | 57499 (28%) | 124385 (33%) |
25-49K | 6129 (13%) | 37532 (18%) | 80082 (21%) | |
50-74K | 7113 (15%) | 30116 (15%) | 54012 (14%) | |
75-99K | 5457 (12%) | 20676 (10%) | 35196 (9%) | |
100-199K | 11159 (24%) | 36989 (18%) | 53371 (14%) | |
200K+ | 7501 (16%) | 17402 (8%) | 20532 (5%) | |
Highest Education Level | No Diploma | 2971 | 44443 | 106910 |
Diploma or GED | 6011 | 83876 | 191398 | |
Some College | 5310 | 43402 | 100968 | |
Assoc. Degree | 1938 | 14072 | 30263 | |
Bachelors Degree | 24395 | 81114 | 113530 | |
Higher Degree | 28161 | 71782 | 90716 | |
Total Housing Units | 51,803 | 234,507 | 432,699 | |
--Owner-Occupied | 15,490 | 87,340 | 171,770 | |
--Renter-Occupied | 29,905 | 112,873 | 195,807 | |
Owner-Occupied Values | < 100K | 485 | 14528 | 61343 |
100-199K | 954 | 18889 | 43671 | |
200-299K | 1961 | 17863 | 25044 | |
300-399K | 2898 | 12789 | 15289 | |
400-499K | 2228 | 7552 | 8892 | |
500K+ | 6964 | 15719 | 17531 | |
Total Working Age Population | 78,028 | 410,316 | 762,300 | |
In Work Force | 55,123 | 261,330 | 458,219 | |
Not In Work Force | 22,905 | 148,986 | 304,081 | |
Workforce Employed | 53,361 | 241,549 | 415,943 | |
Workforce Unemployed | 1,721 | 19,595 | 42,058 | |
Civlian Workforce | 55,082 | 261,144 | 458,001 | |
Military Workforce | 41 | 186 | 218 | |
Total Households | 45,395 | 200,214 | 367,577 | |
Family Households | 13,406 | 85,758 | 184,048 | |
Non-Family Households | 31,989 | 114,455 | 183,529 | |
Married Couple | 11,186 | 49,400 | 85,876 | |
Other Family | 2,220 | 36,358 | 98,173 | |
Married w/Child | 3,019 | 16,730 | 30,554 | |
Single Male w/Child | 236 | 3,027 | 8,226 | |
Single Female w/Child | 719 | 13,397 | 39,292 |
Population Change Last Two Decades - Plus Projection
2000 | % | 2010 | % | 2020 | % | 2030 | |
---|---|---|---|---|---|---|---|
New Jersey | 8,414,350 | +4 | 8,791,894 | +4 | 9,132,700 | +4 | 9,530,900 |
Camden County | 508,932 | +1 | 513,657 | 0 | 511,800 | +2 | 521,000 |
Gloucester County | 254,673 | +13 | 288,288 | +1 | 292,000 | +5 | 305,800 |
Pennsylvania | 12,281,054 | +3 | 12,702,379 | +4 | 13,230,170 | +4 | 13,759,594 |
Delaware County | 550,864 | +1 | 558,979 | +5 | 588,436 | +6 | 622,307 |
Montgomery County | 750,097 | +7 | 799,874 | +5 | 838,883 | +6 | 891,868 |
Philadelphia County | 1,517,550 | +1 | 1,526,006 | +8 | 1,653,729 | +6 | 1,753,054 |
Total Working Age Population:
Total Households:
Total Working Age Population:
Total Households:
Total Working Age Population:
Total Households: