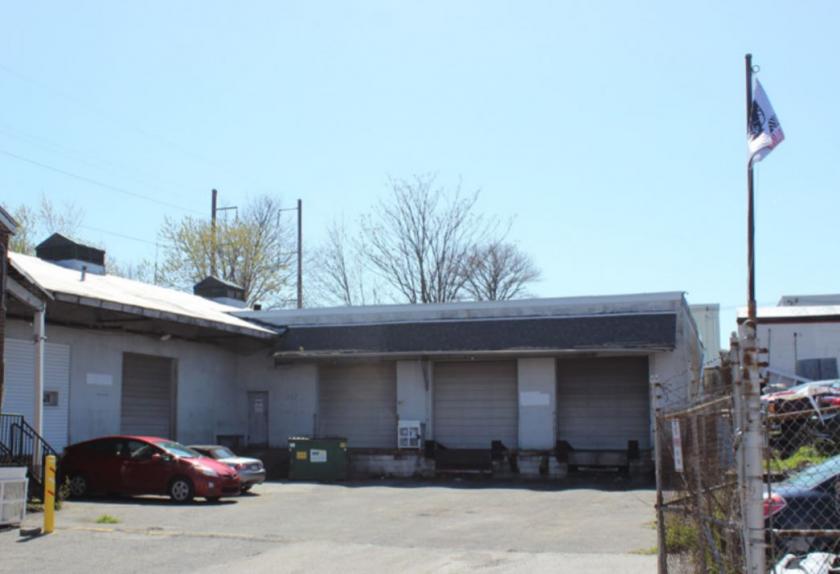
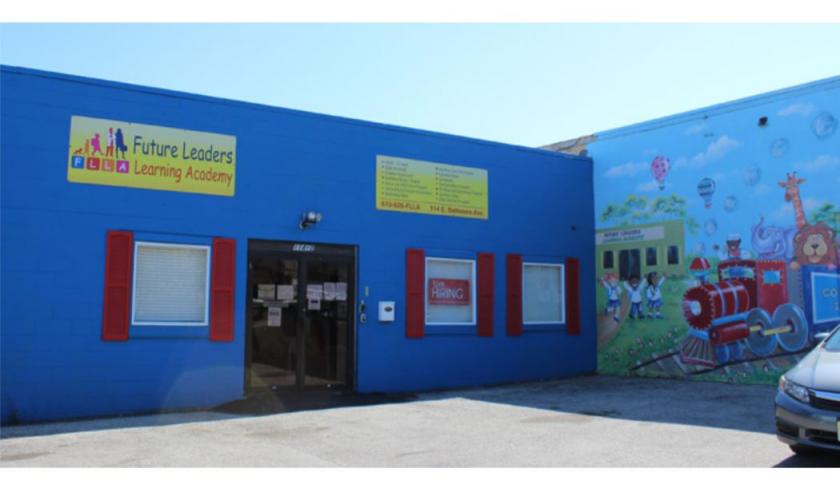
Industrial Properties
114 East Baltimore Avenue Clifton Heights, PA 19018
114 East Baltimore Avenue Clifton Heights, PA 19018
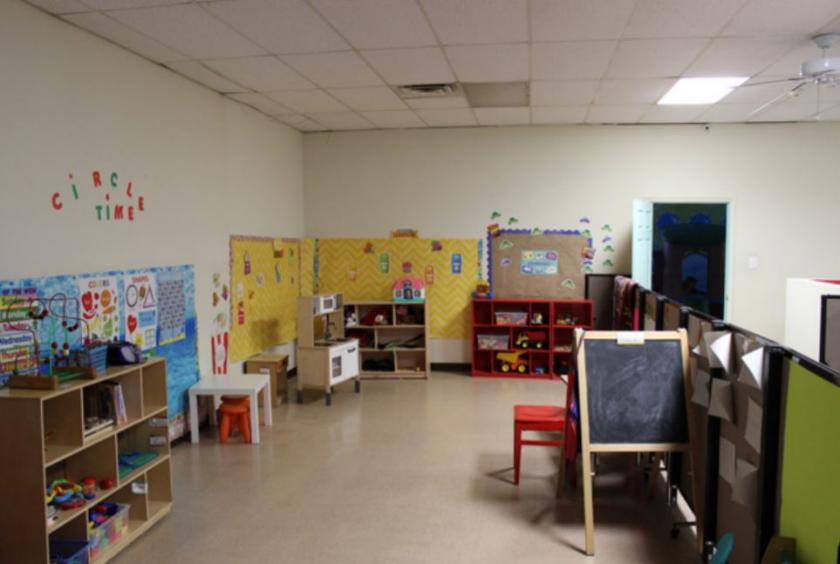
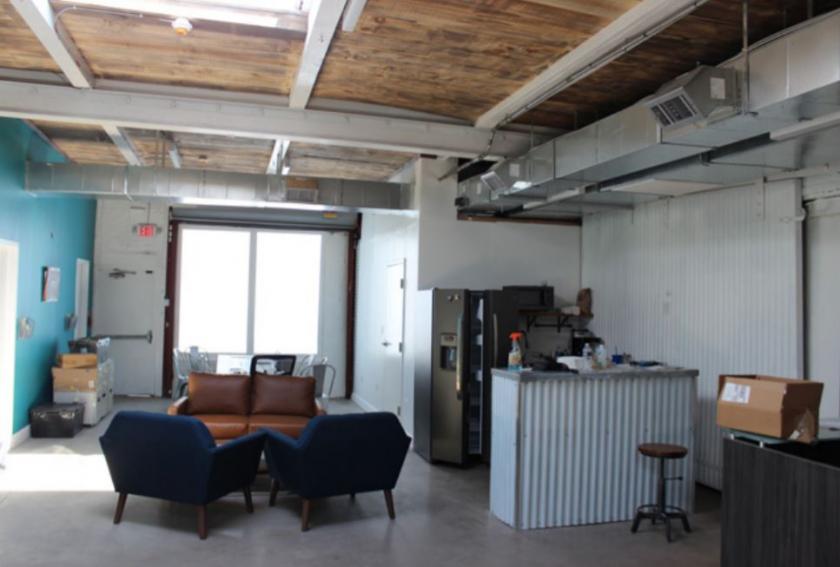
Details & Description
Additional Photos
Listing Agents

Joseph Batres
O: 215-253-5737
jbatres@geisrealty.com
O: 215-253-5737
jbatres@geisrealty.com

Brian Geis
O: 610-975-4270
bgeis@geisrealty.com
O: 610-975-4270
bgeis@geisrealty.com

Louis Tonon
O: 215-568-1590
ltonon@geisrealty.com
O: 215-568-1590
ltonon@geisrealty.com
While we strive to provide the most accurate information, all listing information, and demographic data, is provided by third-parties. As such, MyEListing will not be responsible for the accuracy of the information. It is strongly recommended that you verify all information with the listing agent, and any relevant agencies, prior to making any decisions.


