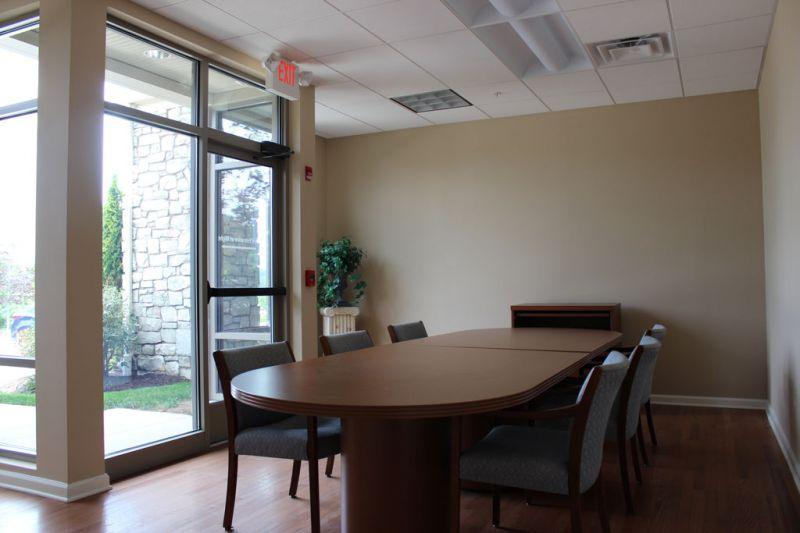
9’ finished ceilings throughout
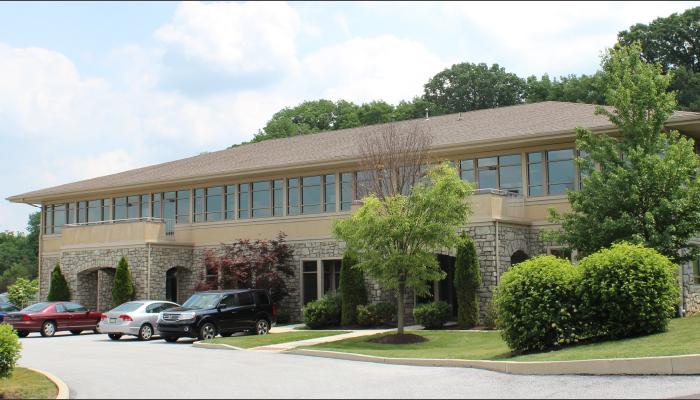
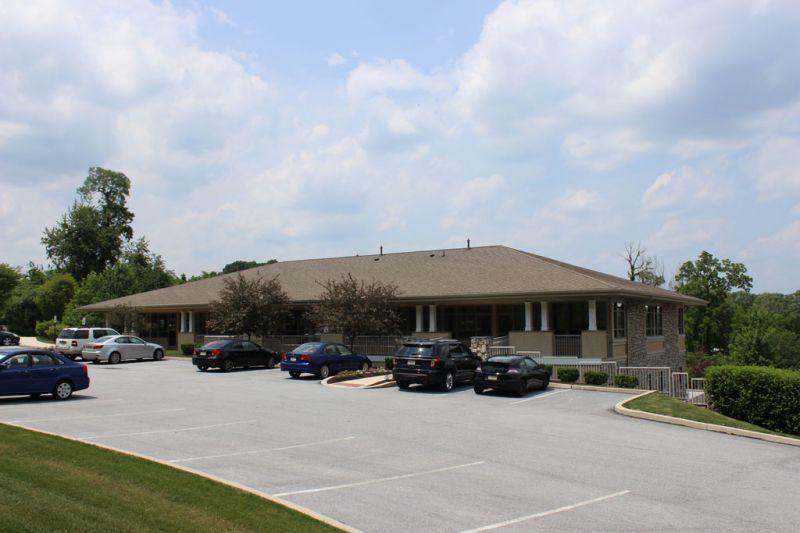
High parking ratio of 4.5/1,000 SF
Timeless architecture & appearance
Scenic views from (2) private terraces
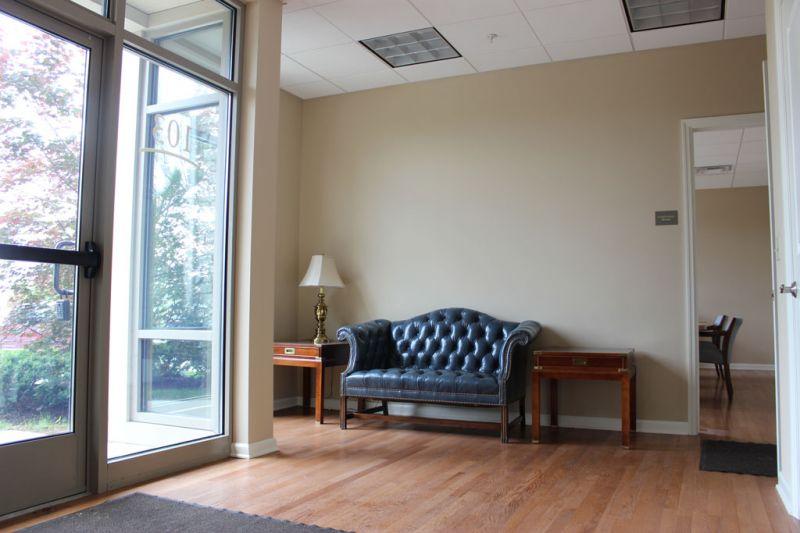
On-grade entrance from parking lot
Dry basement storage available
Impressive and expansive glass line
ADA accessible
Building signage available
NEARBY AMENTIES
Conveniently located at Routes 422 & 29 Interchange
Convenient access to shopping centers, banking, restaurants, and daycare facilities
Perkiomen Creek trail nearby
No part of this information may be copied, reproduced, repurposed, or screen-captured for any commercial purpose without prior written authorization from MyEListing.
While we strive to provide the most accurate information, all listing information, and demographic data, is provided by third-parties. As such, MyEListing will not be responsible for the accuracy of the information. It is strongly recommended that you verify all information with the listing agent, and any relevant agencies, prior to making any decisions.
What is the asking price for 399 Arcola Road in Collegeville?
The asking price for 399 Arcola Road is $1,535,800
What is the building size of this Office property in Collegeville, PA?
The size of the building/unit at 399 Arcola Road in Collegeville is 6,480 square feet
What kind of Office is the propery at 399 Arcola Road?
The property at 399 Arcola Road Collegeville, PA 19426 is listed as a Medical Office property
What is the population within 1 mile of 399 Arcola Road in Collegeville?
The population within 1 mile of 399 Arcola Road Collegeville, PA 19426 is 3,547 people.
Who do I contact for questions about 399 Arcola Road?
You should contact the listing agent,
Paul Wolfson, for any details regarding this commercial listing.