Flex-Office-Warehouse
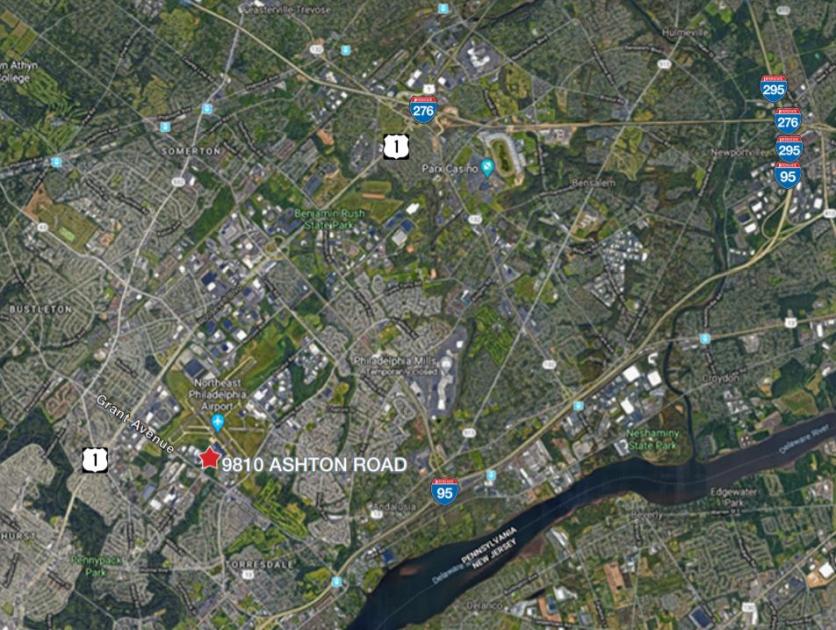
9810 Ashton Road Philadelphia, PA 19114
9810 Ashton Road Philadelphia, PA 19114
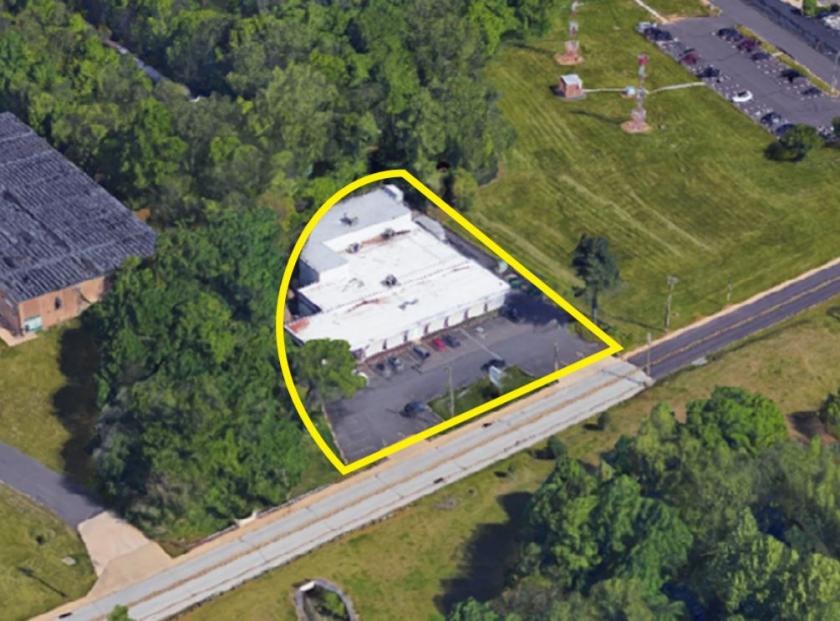
Details & Description
Listing Agents

Frank Cullen
O: 215-701-3272
fcullen@geisrealty.com
O: 215-701-3272
fcullen@geisrealty.com
While we strive to provide the most accurate information, all listing information, and demographic data, is provided by third-parties. As such, MyEListing will not be responsible for the accuracy of the information. It is strongly recommended that you verify all information with the listing agent, and any relevant agencies, prior to making any decisions.