14´-15´ slab-to-slab ceilings in office floors
Skylight atrium in center of building
Turn-key tenant improvements
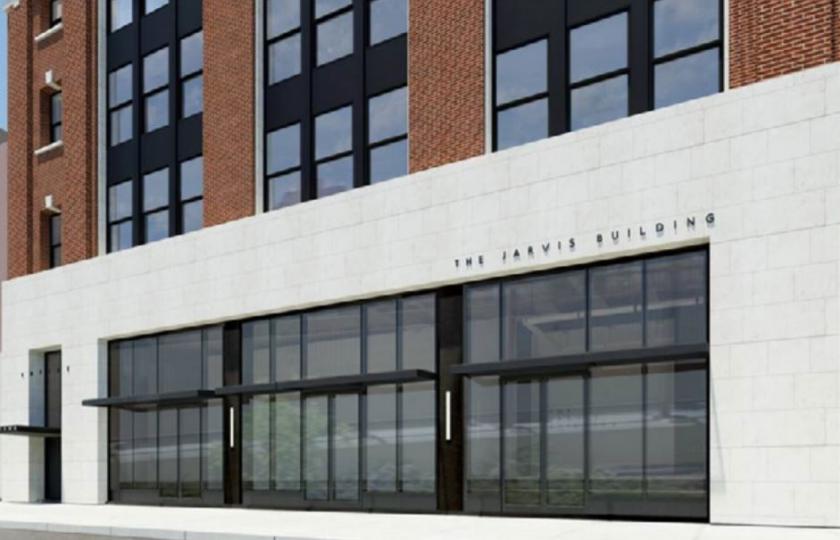
Currently under renovation
Expected completion Q1 2021
Multi-family units to be built on the 4th & 5th floors
Café in lobby with inside and outdoor seating
Individual HVAC units per floor with separate meters per tenant
Full commission payable to brokers
Signature signage rights available for two-floor users
Abundant parking within two block radius
Access to I-676 and other major roadways
Two passenger elevators
No part of this information may be copied, reproduced, repurposed, or screen-captured for any commercial purpose without prior written authorization from MyEListing.
While we strive to provide the most accurate information, all listing information, and demographic data, is provided by third-parties. As such, MyEListing will not be responsible for the accuracy of the information. It is strongly recommended that you verify all information with the listing agent, and any relevant agencies, prior to making any decisions.
What is the asking price for 1209 Vine Street in Philadelphia?
The asking price for 1209 Vine Street is $23.00 a SF per Year
What is the building size of this commercial Office property?
The size of this lease property at '.1209 Vine Street.' is 37122 square feet
What is the population within 1 mile of 1209 Vine Street in Philadelphia?
The population within 1 mile of 1209 Vine Street Philadelphia, PA 19107 is 70,631 people.
Who do I contact for questions about 1209 Vine Street?
You should contact the listing agent,
Thomas Bond, for any details regarding this commercial listing.