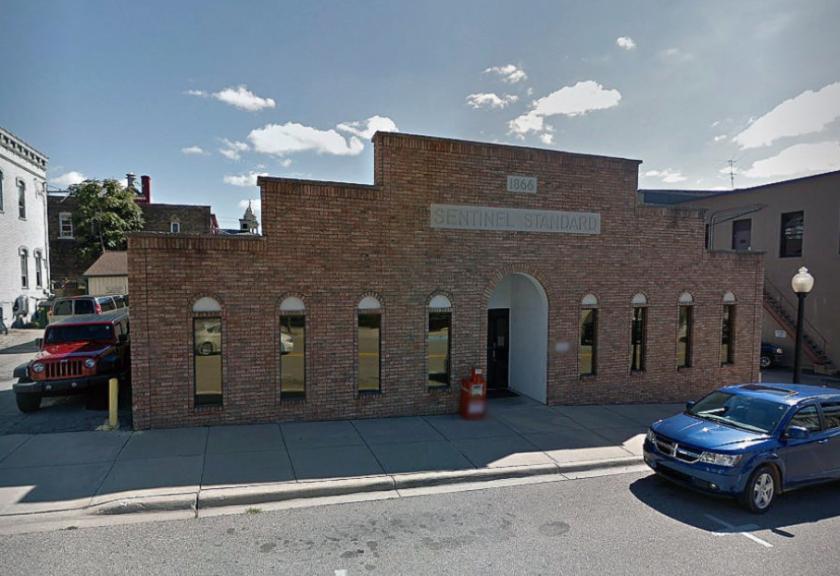
Flex-Office-Warehouse
114 North Depot Street Ionia, MI 48846
114 North Depot Street Ionia, MI 48846
Details & Description
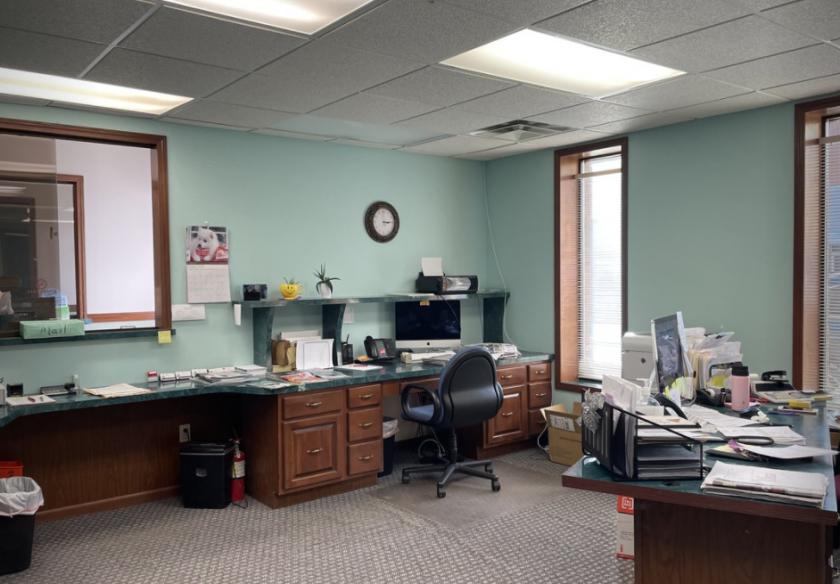
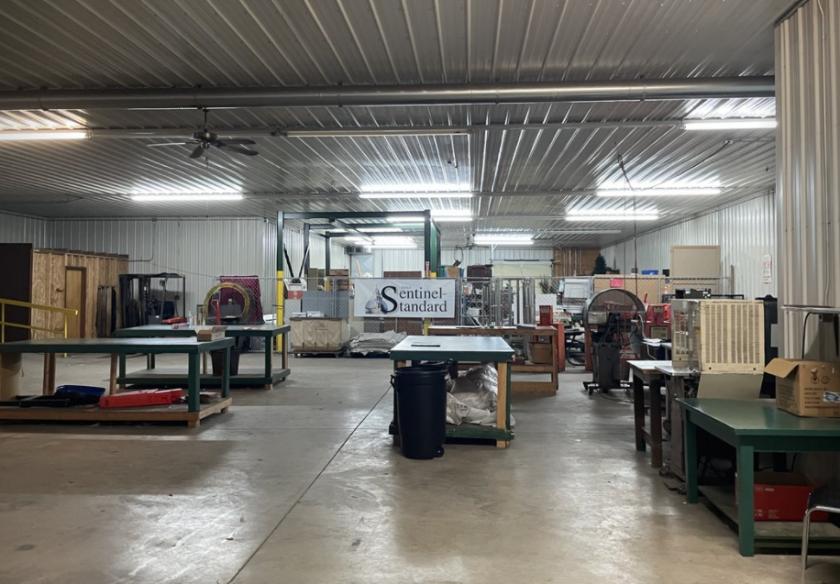
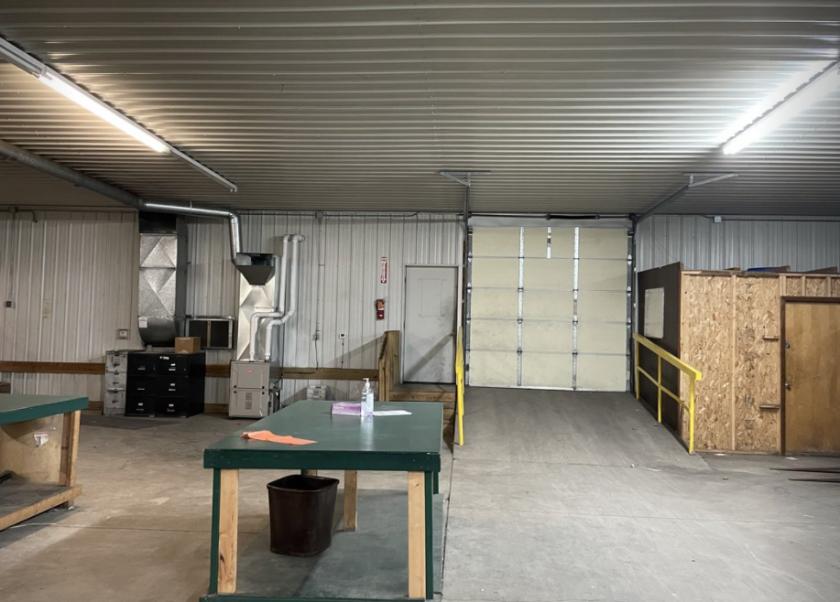
Additional Photos

Listing Agents

Jodi Milks
O: 269-459-0439
M: 269-207-1040
jodim@naiwwm.com
O: 269-459-0439
M: 269-207-1040
jodim@naiwwm.com
While we strive to provide the most accurate information, all listing information, and demographic data, is provided by third-parties. As such, MyEListing will not be responsible for the accuracy of the information. It is strongly recommended that you verify all information with the listing agent, and any relevant agencies, prior to making any decisions.


