Retail Space
18790 NW Idanha St Portland, OR 97229
18790 NW Idanha St Portland, OR 97229
Details & Description
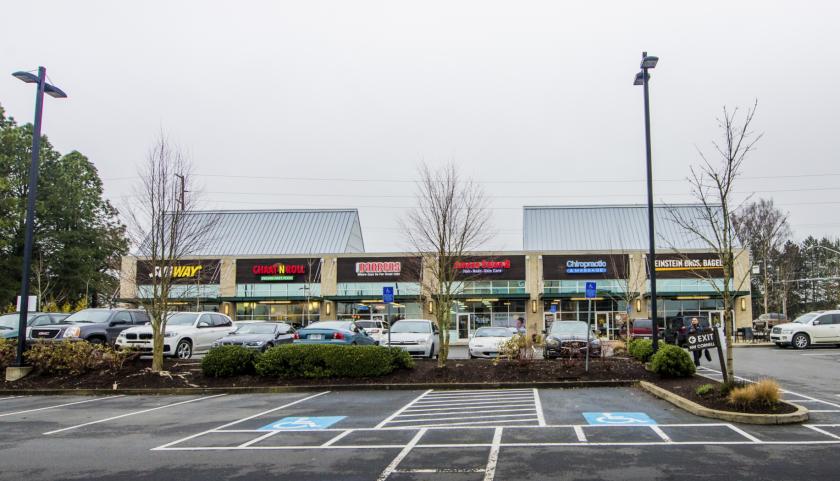
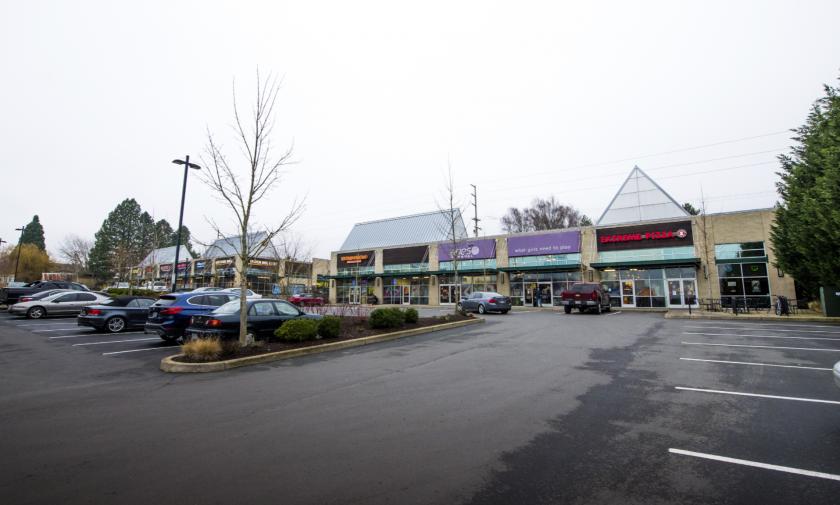
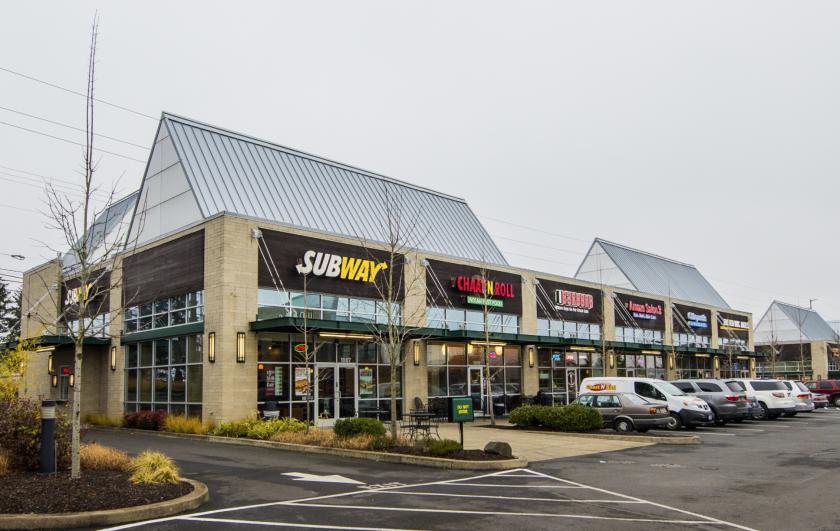
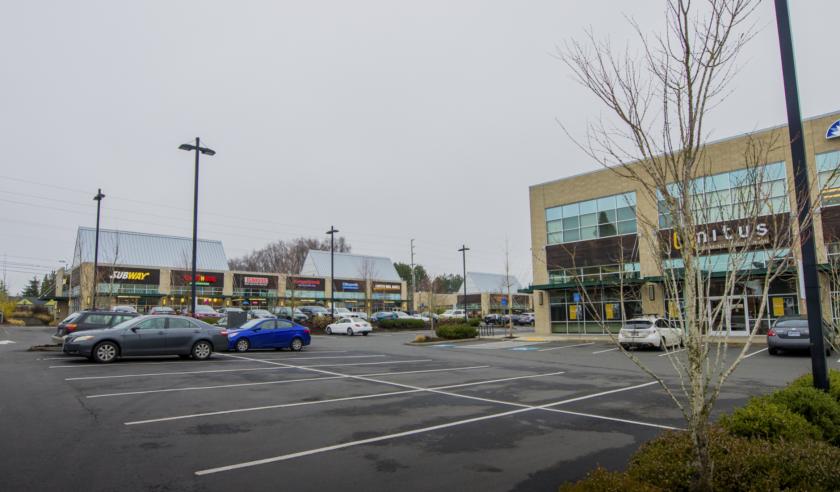
Additional Photos
Listing Agents

Chris Lio
O: 503-972-7227
M: 503-804-2929
clio@naielliott.com
O: 503-972-7227
M: 503-804-2929
clio@naielliott.com

Jamie Nelson
O: 503-972-7202
M: 503-913-9016
jnelson@naielliott.com
O: 503-972-7202
M: 503-913-9016
jnelson@naielliott.com
While we strive to provide the most accurate information, all listing information, and demographic data, is provided by third-parties. As such, MyEListing will not be responsible for the accuracy of the information. It is strongly recommended that you verify all information with the listing agent, and any relevant agencies, prior to making any decisions.


