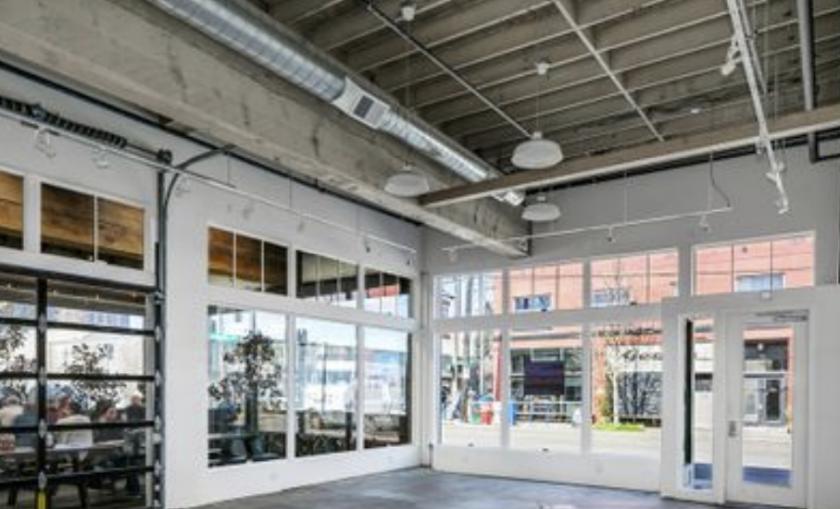
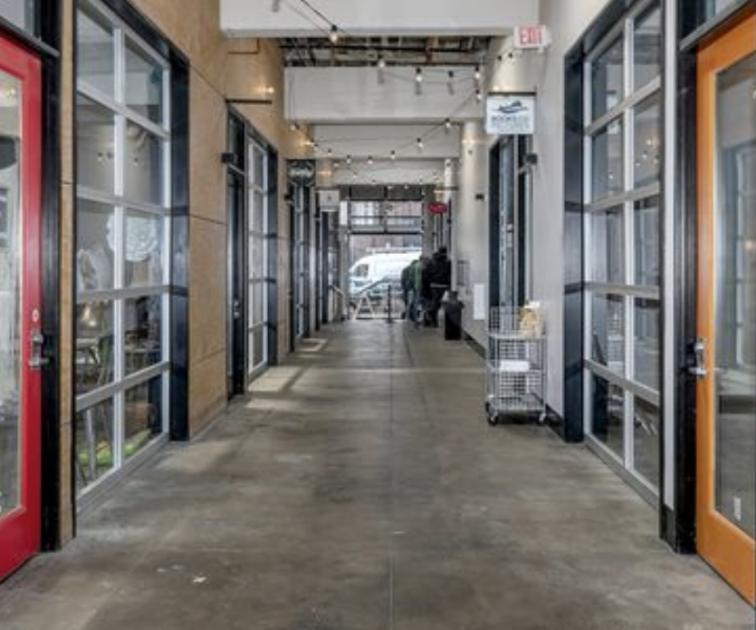
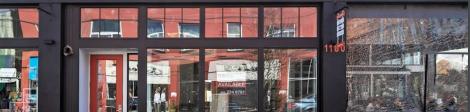
1-Mile | 3-Miles | 5-Miles | ||
---|---|---|---|---|
Total Population | 21,336 | 218,326 | 484,639 | |
Population Median Age | 39 | 40 | 39 | |
Population by Age | 0-9 Yrs | 1410 (6%) | 16740 (7%) | 46312 (9%) |
10-19 Yrs | 1266 (5%) | 14860 (6%) | 40364 (8%) | |
20-29 Yrs | 4245 (19%) | 40266 (18%) | 78471 (16%) | |
30-39 Yrs | 5771 (27%) | 48002 (21%) | 98512 (20%) | |
40-49 Yrs | 3161 (14%) | 31828 (14%) | 72014 (14%) | |
50-59 Yrs | 2058 (9%) | 24116 (11%) | 56328 (11%) | |
60-69 Yrs | 1902 (8%) | 23597 (10%) | 53131 (10%) | |
70+ Yrs | 1523 (7%) | 18917 (8%) | 39506 (8%) | |
Median HH Income | $76,096 | $73,037 | $74,996 | |
Total Household Income | < 24K | 1795 (17%) | 20931 (19%) | 37460 (17%) |
25-49K | 1603 (15%) | 18278 (16%) | 36389 (16%) | |
50-74K | 1687 (16%) | 16027 (14%) | 33569 (15%) | |
75-99K | 1396 (13%) | 12613 (11%) | 27656 (12%) | |
100-199K | 2714 (26%) | 27229 (25%) | 55510 (25%) | |
200K+ | 1098 (10%) | 13011 (12%) | 24248 (11%) | |
Highest Education Level | No Diploma | 515 | 5670 | 18783 |
Diploma or GED | 1500 | 16011 | 45087 | |
Some College | 3196 | 30572 | 70173 | |
Assoc. Degree | 945 | 9399 | 22523 | |
Bachelors Degree | 6462 | 63930 | 124521 | |
Higher Degree | 4914 | 47336 | 88607 | |
Total Housing Units | 11,180 | 117,154 | 229,712 | |
--Owner-Occupied | 3,797 | 42,963 | 109,091 | |
--Renter-Occupied | 6,496 | 65,126 | 105,741 | |
Owner-Occupied Values | < 100K | 53 | 441 | 1895 |
100-199K | 38 | 570 | 3564 | |
200-299K | 203 | 3264 | 13873 | |
300-399K | 532 | 6276 | 21717 | |
400-499K | 788 | 7862 | 21332 | |
500K+ | 2182 | 24549 | 46710 | |
Total Working Age Population | 19,013 | 193,540 | 414,471 | |
In Work Force | 14,457 | 137,730 | 296,693 | |
Not In Work Force | 4,555 | 55,810 | 117,777 | |
Workforce Employed | 13,886 | 131,759 | 283,634 | |
Workforce Unemployed | 571 | 5,881 | 12,892 | |
Civlian Workforce | 14,457 | 137,640 | 296,526 | |
Military Workforce | 0 | 90 | 168 | |
Total Households | 10,293 | 108,089 | 214,832 | |
Family Households | 3,828 | 41,514 | 102,009 | |
Non-Family Households | 6,466 | 66,575 | 112,824 | |
Married Couple | 3,140 | 34,479 | 79,726 | |
Other Family | 688 | 7,034 | 22,283 | |
Married w/Child | 1,176 | 12,632 | 31,506 | |
Single Male w/Child | 57 | 1,116 | 3,214 | |
Single Female w/Child | 277 | 2,475 | 8,443 |
Population Change Last Two Decades - Plus Projection
2000 | % | 2010 | % | 2020 | % | 2030 | |
---|---|---|---|---|---|---|---|
Oregon | 3,421,399 | +12 | 3,831,074 | +11 | 4,264,810 | +11 | 4,727,438 |
Clackamas County | 338,391 | +11 | 375,992 | +14 | 428,860 | +14 | 490,011 |
Multnomah County | 660,486 | +11 | 735,334 | +12 | 822,675 | +10 | 906,904 |
Washington County | 445,342 | +19 | 529,710 | +17 | 619,337 | +16 | 718,633 |
Washington | 5,894,121 | +14 | 6,724,540 | +14 | 7,638,415 | +11 | 8,503,178 |
Clark County | 345,238 | +23 | 425,363 | +17 | 499,400 | +16 | 576,879 |
Total Working Age Population:
Total Households:
Total Working Age Population:
Total Households:
Total Working Age Population:
Total Households: