Specialty Real Estate
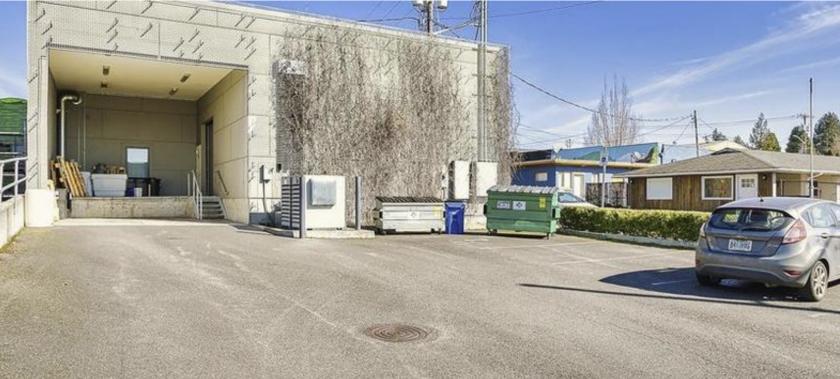
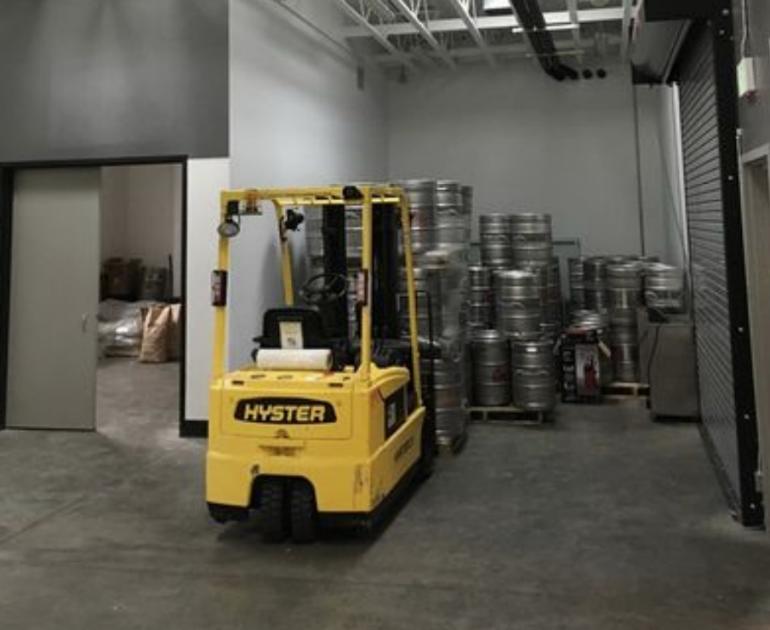
1834 Main Street Washougal, WA 98671
1834 Main Street Washougal, WA 98671

Details & Description
Listing Agents

Joe Sandahl
O: 503-972-7192
M: 503-310-9973
jsandahl@naielliott.com
O: 503-972-7192
M: 503-310-9973
jsandahl@naielliott.com

Matthew Sichel
O: 503-972-7206
M: 503-702-5955
msichel@naielliott.com
O: 503-972-7206
M: 503-702-5955
msichel@naielliott.com
While we strive to provide the most accurate information, all listing information, and demographic data, is provided by third-parties. As such, MyEListing will not be responsible for the accuracy of the information. It is strongly recommended that you verify all information with the listing agent, and any relevant agencies, prior to making any decisions.