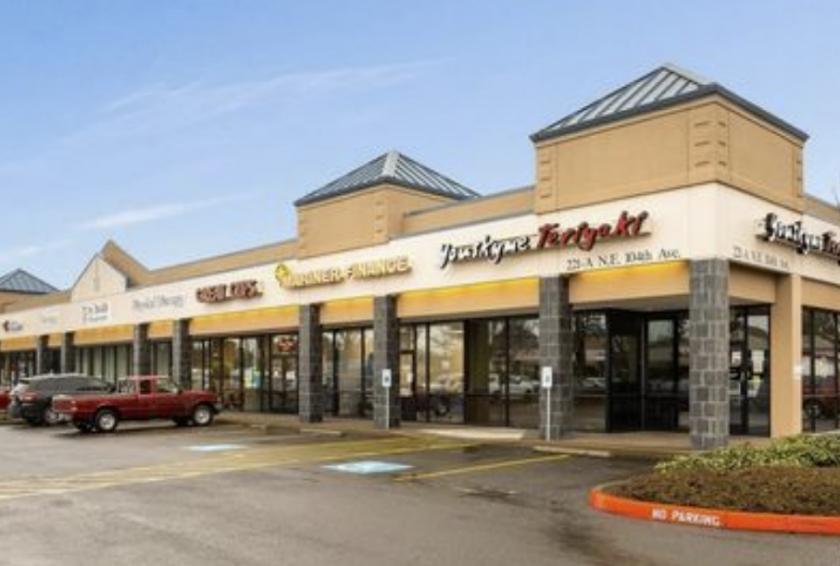
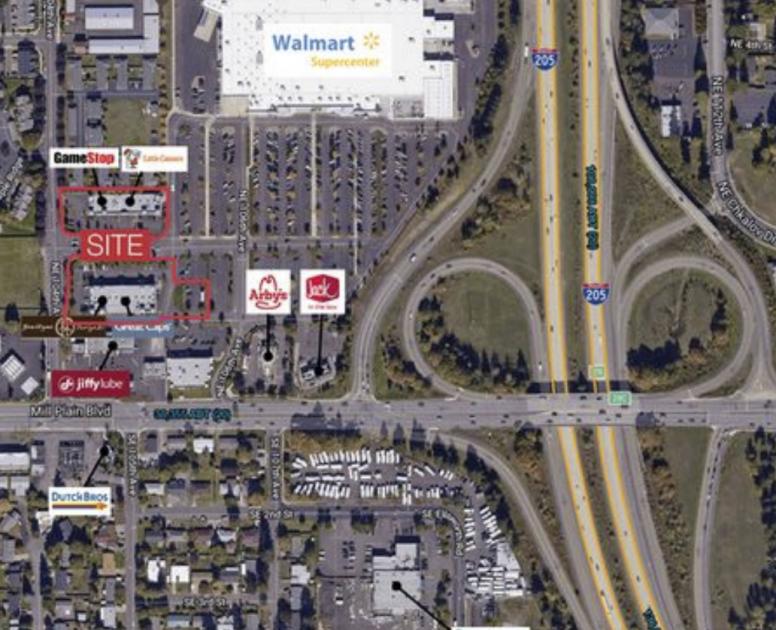
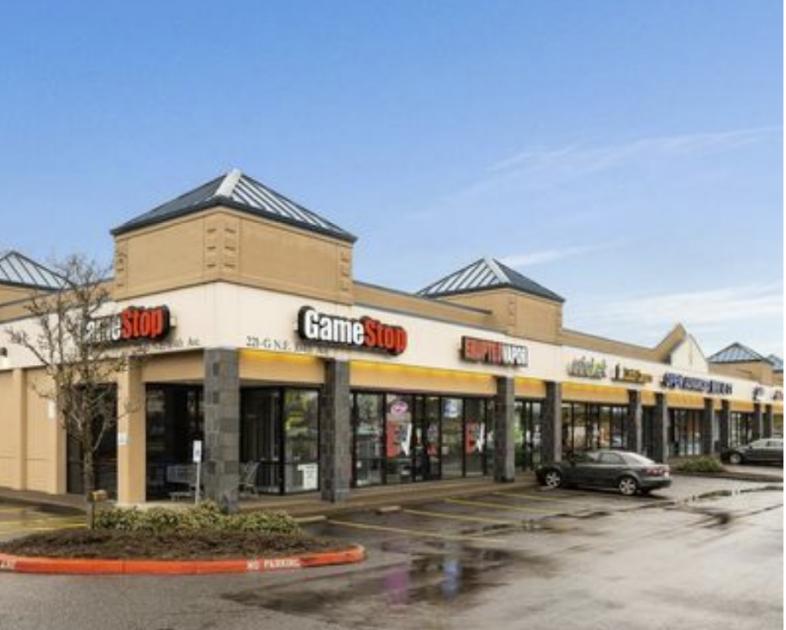
1-Mile | 3-Miles | 5-Miles | ||
---|---|---|---|---|
Total Population | 14,023 | 103,936 | 248,252 | |
Population Median Age | 40 | 38 | 38 | |
Population by Age | 0-9 Yrs | 1724 (12%) | 13415 (12%) | 31249 (12%) |
10-19 Yrs | 1370 (9%) | 12639 (12%) | 30917 (12%) | |
20-29 Yrs | 2196 (15%) | 16216 (15%) | 36040 (14%) | |
30-39 Yrs | 1822 (12%) | 15015 (14%) | 35969 (14%) | |
40-49 Yrs | 2149 (15%) | 12568 (12%) | 33085 (13%) | |
50-59 Yrs | 1501 (10%) | 11155 (10%) | 30607 (12%) | |
60-69 Yrs | 1668 (11%) | 11917 (11%) | 27221 (10%) | |
70+ Yrs | 1593 (11%) | 11010 (10%) | 23163 (9%) | |
Median HH Income | $60,103 | $63,462 | $66,384 | |
Total Household Income | < 24K | 963 (16%) | 5593 (14%) | 14145 (14%) |
25-49K | 1433 (24%) | 9602 (24%) | 20748 (21%) | |
50-74K | 1228 (21%) | 8592 (21%) | 19057 (20%) | |
75-99K | 642 (11%) | 5253 (13%) | 13858 (14%) | |
100-199K | 1323 (22%) | 8744 (21%) | 22325 (23%) | |
200K+ | 177 (3%) | 2027 (5%) | 4875 (5%) | |
Highest Education Level | No Diploma | 733 | 6840 | 15679 |
Diploma or GED | 2828 | 18384 | 42992 | |
Some College | 2809 | 19251 | 46058 | |
Assoc. Degree | 1185 | 7238 | 17949 | |
Bachelors Degree | 1649 | 12671 | 31215 | |
Higher Degree | 882 | 6067 | 16566 | |
Total Housing Units | 6,029 | 41,747 | 99,660 | |
--Owner-Occupied | 3,082 | 21,086 | 55,151 | |
--Renter-Occupied | 2,684 | 18,724 | 39,856 | |
Owner-Occupied Values | < 100K | 71 | 889 | 2577 |
100-199K | 566 | 2930 | 7252 | |
200-299K | 1393 | 7814 | 19685 | |
300-399K | 724 | 5608 | 15010 | |
400-499K | 194 | 1871 | 5739 | |
500K+ | 135 | 1973 | 4888 | |
Total Working Age Population | 11,396 | 82,853 | 198,433 | |
In Work Force | 7,349 | 53,815 | 131,437 | |
Not In Work Force | 4,047 | 29,038 | 66,995 | |
Workforce Employed | 6,961 | 50,858 | 124,085 | |
Workforce Unemployed | 302 | 2,819 | 7,011 | |
Civlian Workforce | 7,264 | 53,677 | 131,096 | |
Military Workforce | 86 | 138 | 341 | |
Total Households | 5,766 | 39,810 | 95,008 | |
Family Households | 3,443 | 25,380 | 60,214 | |
Non-Family Households | 2,323 | 14,430 | 34,793 | |
Married Couple | 2,479 | 18,297 | 43,855 | |
Other Family | 965 | 7,083 | 16,359 | |
Married w/Child | 961 | 7,147 | 17,605 | |
Single Male w/Child | 265 | 1,191 | 2,611 | |
Single Female w/Child | 307 | 2,845 | 6,044 |
Population Change Last Two Decades - Plus Projection
2000 | % | 2010 | % | 2020 | % | 2030 | |
---|---|---|---|---|---|---|---|
Oregon | 3,421,399 | +12 | 3,831,074 | +11 | 4,264,810 | +11 | 4,727,438 |
Multnomah County | 660,486 | +11 | 735,334 | +12 | 822,675 | +10 | 906,904 |
Washington | 5,894,121 | +14 | 6,724,540 | +14 | 7,638,415 | +11 | 8,503,178 |
Clark County | 345,238 | +23 | 425,363 | +17 | 499,400 | +16 | 576,879 |
Total Working Age Population:
Total Households:
Total Working Age Population:
Total Households:
Total Working Age Population:
Total Households: