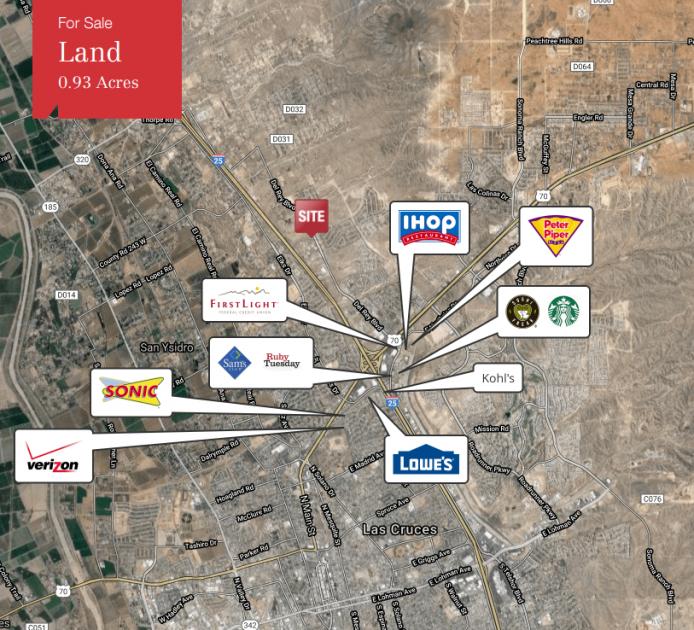
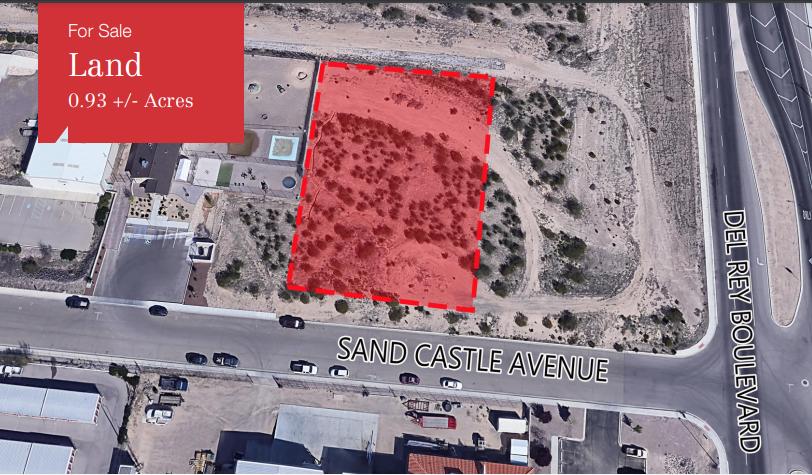
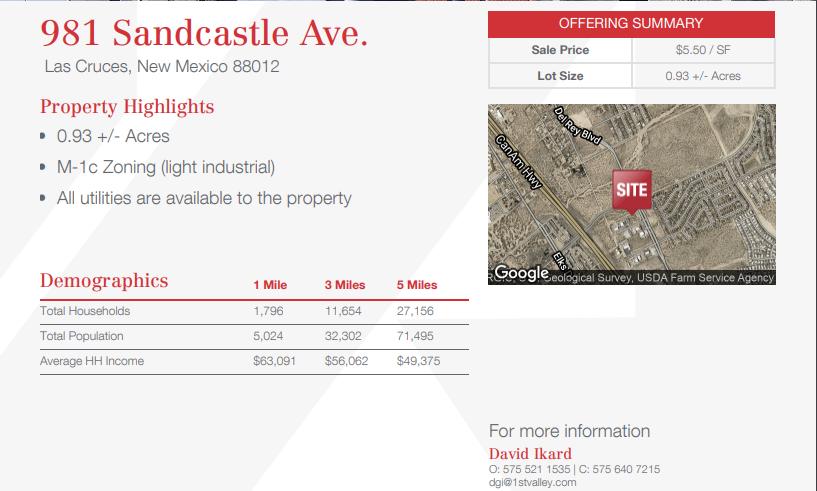
1-Mile | 3-Miles | 5-Miles | ||
---|---|---|---|---|
Total Population | 4,554 | 39,229 | 85,507 | |
Population Median Age | 35 | 37 | 37 | |
Population by Age | 0-9 Yrs | 875 (19%) | 6144 (15%) | 11651 (13%) |
10-19 Yrs | 666 (14%) | 5191 (13%) | 11453 (13%) | |
20-29 Yrs | 543 (11%) | 6409 (16%) | 14874 (17%) | |
30-39 Yrs | 677 (14%) | 4823 (12%) | 10444 (12%) | |
40-49 Yrs | 364 (7%) | 3730 (9%) | 8945 (10%) | |
50-59 Yrs | 475 (10%) | 4495 (11%) | 9387 (10%) | |
60-69 Yrs | 570 (12%) | 4278 (10%) | 9195 (10%) | |
70+ Yrs | 384 (8%) | 4159 (10%) | 9558 (11%) | |
Median HH Income | $58,964 | $51,908 | $46,744 | |
Total Household Income | < 24K | 291 (19%) | 3255 (22%) | 9286 (28%) |
25-49K | 379 (24%) | 3700 (25%) | 8202 (25%) | |
50-74K | 212 (13%) | 2168 (15%) | 5251 (16%) | |
75-99K | 241 (15%) | 1886 (13%) | 3624 (11%) | |
100-199K | 389 (25%) | 2959 (20%) | 5432 (16%) | |
200K+ | 21 (1%) | 309 (2%) | 949 (2%) | |
Highest Education Level | No Diploma | 268 | 2861 | 7251 |
Diploma or GED | 603 | 5838 | 12704 | |
Some College | 710 | 5887 | 12574 | |
Assoc. Degree | 333 | 2355 | 4800 | |
Bachelors Degree | 576 | 4445 | 9614 | |
Higher Degree | 285 | 2852 | 6621 | |
Total Housing Units | 1,611 | 15,673 | 36,844 | |
--Owner-Occupied | 1,218 | 9,904 | 20,235 | |
--Renter-Occupied | 314 | 4,373 | 12,510 | |
Owner-Occupied Values | < 100K | 107 | 1670 | 4235 |
100-199K | 906 | 5753 | 10079 | |
200-299K | 151 | 1788 | 3812 | |
300-399K | 50 | 397 | 1117 | |
400-499K | 3 | 123 | 610 | |
500K+ | 0 | 173 | 383 | |
Total Working Age Population | 3,228 | 29,927 | 67,424 | |
In Work Force | 1,982 | 18,097 | 39,817 | |
Not In Work Force | 1,246 | 11,830 | 27,607 | |
Workforce Employed | 1,857 | 16,918 | 36,796 | |
Workforce Unemployed | 121 | 1,063 | 2,705 | |
Civlian Workforce | 1,978 | 17,980 | 39,501 | |
Military Workforce | 4 | 117 | 316 | |
Total Households | 1,531 | 14,277 | 32,745 | |
Family Households | 1,173 | 10,082 | 21,590 | |
Non-Family Households | 359 | 4,195 | 11,155 | |
Married Couple | 831 | 7,079 | 14,487 | |
Other Family | 342 | 3,003 | 7,103 | |
Married w/Child | 360 | 2,767 | 5,487 | |
Single Male w/Child | 9 | 288 | 713 | |
Single Female w/Child | 150 | 1,324 | 3,191 |
Population Change Last Two Decades - Plus Projection
2000 | % | 2010 | % | 2020 | % | 2030 | |
---|---|---|---|---|---|---|---|
New Mexico | 1,819,046 | +13 | 2,059,179 | +6 | 2,187,183 | +6 | 2,308,475 |
Doña Ana County | 174,682 | +20 | 209,233 | +11 | 232,946 | +9 | 255,070 |
Total Working Age Population:
Total Households:
Total Working Age Population:
Total Households:
Total Working Age Population:
Total Households: