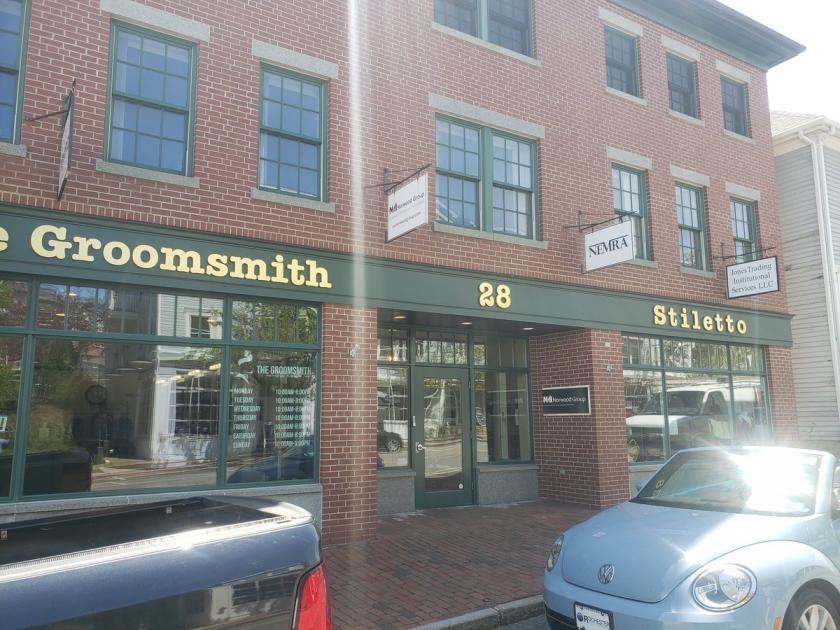
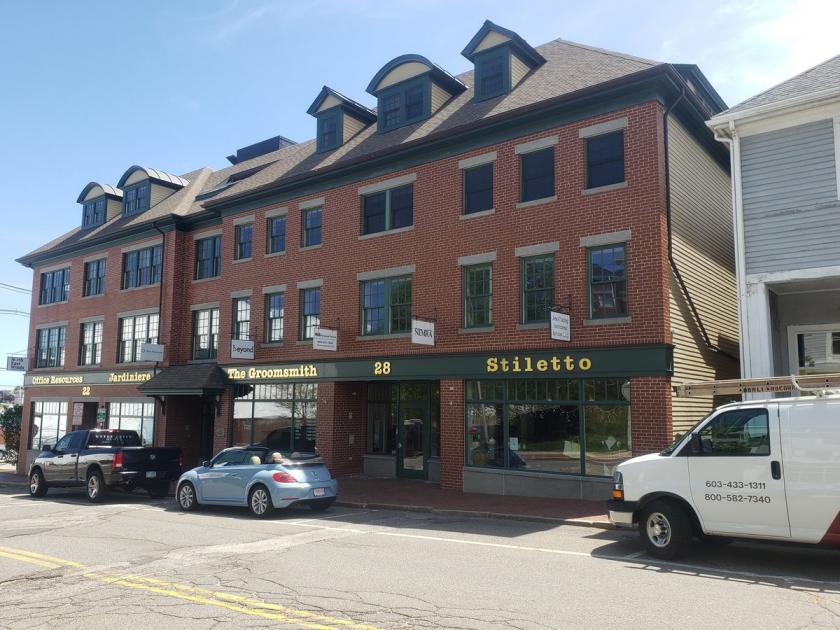
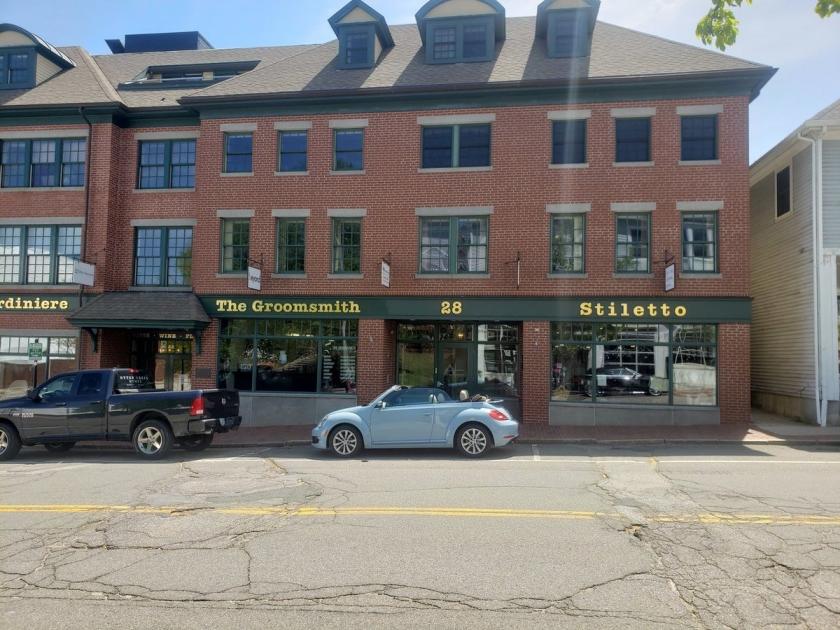
Office Space
28 Deer Street Portsmouth, NH 03801
28 Deer Street Portsmouth, NH 03801
Details & Description
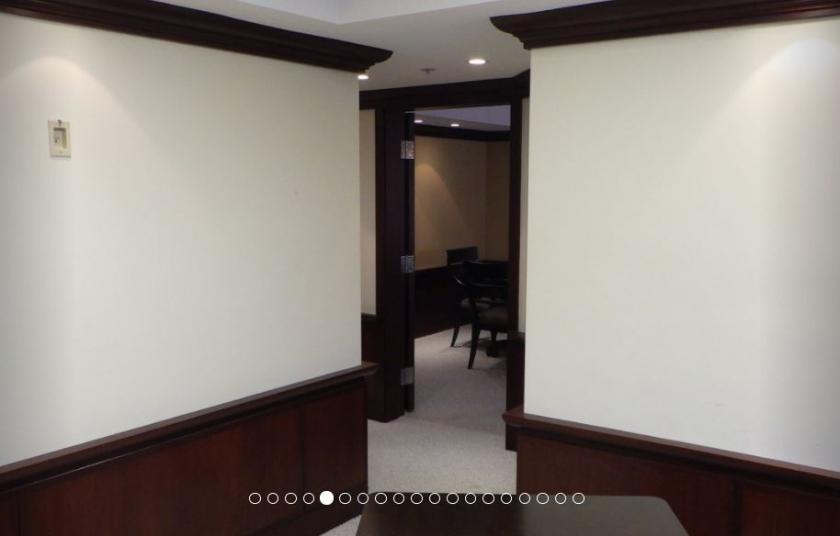
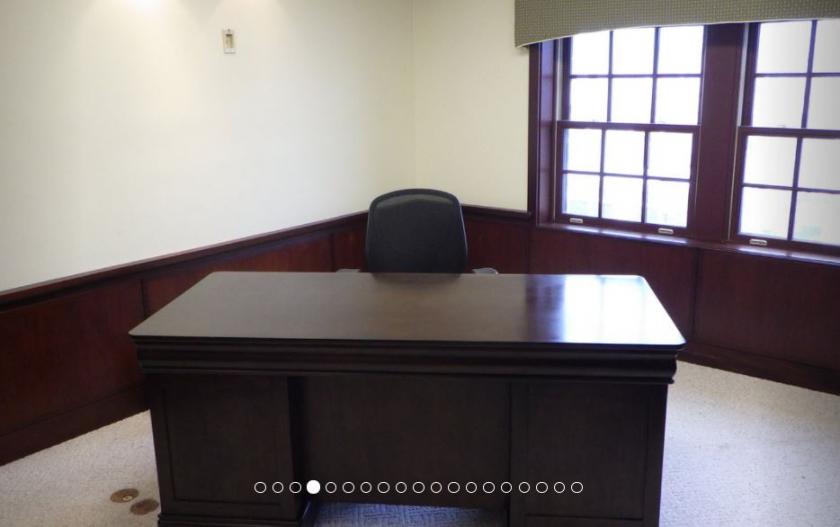
Additional Photos

Listing Agents

Greg Whalen
O: 603-637-2019
M: 603-674-7800
gwhalen@nainorwoodgroup.com
O: 603-637-2019
M: 603-674-7800
gwhalen@nainorwoodgroup.com

Brian M. Obrien
O: 603-431-3001
M: 603-657-1942
bobrien@nainorwoodgroup.com
O: 603-431-3001
M: 603-657-1942
bobrien@nainorwoodgroup.com
While we strive to provide the most accurate information, all listing information, and demographic data, is provided by third-parties. As such, MyEListing will not be responsible for the accuracy of the information. It is strongly recommended that you verify all information with the listing agent, and any relevant agencies, prior to making any decisions.