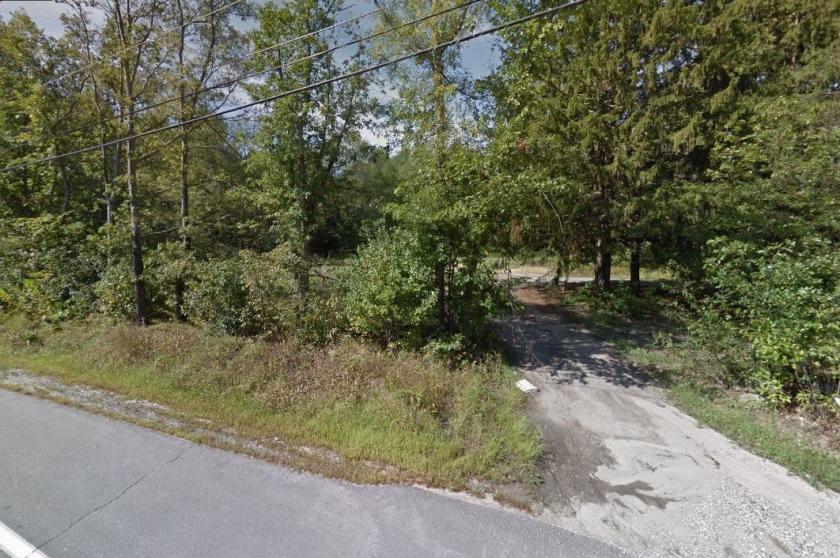
This development opportunity consists of 4.59± acres of prime commercial land. Conveniently located directly off Route 101 on Route 107, it is highly visible and lends itself to a variety of commercial uses. Level topography.
Property Highlights Include:
**4.59 ± acres of versatile developable commercial land located minutes from major highways and downtown
**Fully approved site plans on hand
**Town Water and propane
**Ideal location for any business needing exposure
** C-1 zoning.
**Permitted uses include: warehousing, retail, office, medical, hotel, and gas stations and many more
**Close proximity to the Seacoast and Manchester Markets
No part of this information may be copied, reproduced, repurposed, or screen-captured for any commercial purpose without prior written authorization from MyEListing.
While we strive to provide the most accurate information, all listing information, and demographic data, is provided by third-parties. As such, MyEListing will not be responsible for the accuracy of the information. It is strongly recommended that you verify all information with the listing agent, and any relevant agencies, prior to making any decisions.
What is the asking price for 3 Chester Road in Raymond?
The asking price for 3 Chester Road is $315,000
How much land does the Raymond, NH property at 3 Chester Road include?
3 Chester Road in Raymond includes 4.590 acres of land
What kind of Land is the propery at 3 Chester Road?
The property at 3 Chester Road Raymond, NH 03077 is listed as a Mixed Use Land Land property
What is the population within 1 mile of 3 Chester Road in Raymond?
The population within 1 mile of 3 Chester Road Raymond, NH 03077 is 1,277 people.
Who do I contact for questions about 3 Chester Road?
You should contact the listing agent,
Deana Arden, for any details regarding this commercial listing.