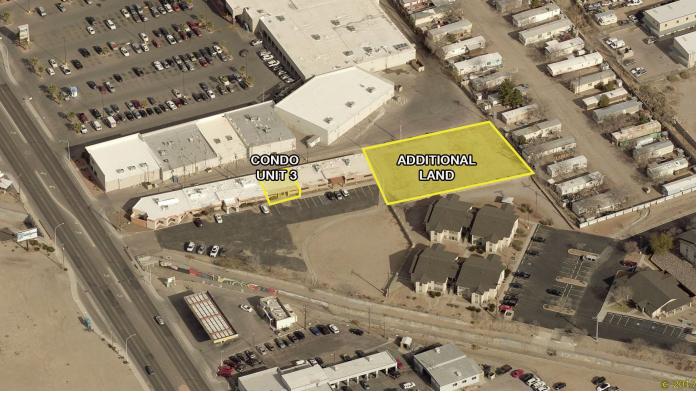
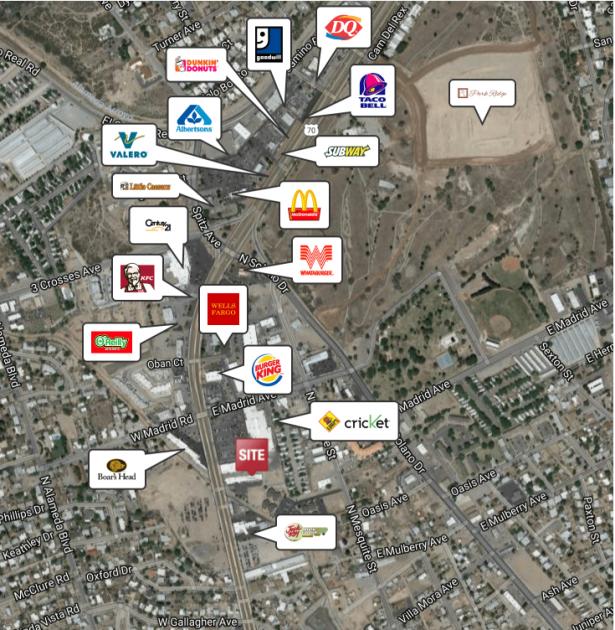
Office Space
2100 North Main Street Las Cruces, NM 88001
2100 North Main Street Las Cruces, NM 88001
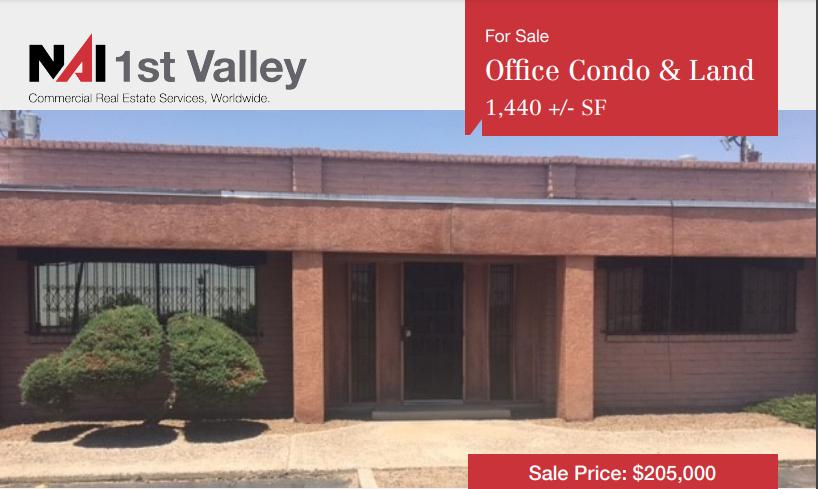
Details & Description
Listing Agents

William Shattuck
O: 575-521-1535
M: 575-546-1995
billshattuck@1stvalley.com
O: 575-521-1535
M: 575-546-1995
billshattuck@1stvalley.com
While we strive to provide the most accurate information, all listing information, and demographic data, is provided by third-parties. As such, MyEListing will not be responsible for the accuracy of the information. It is strongly recommended that you verify all information with the listing agent, and any relevant agencies, prior to making any decisions.