Specialty Real Estate
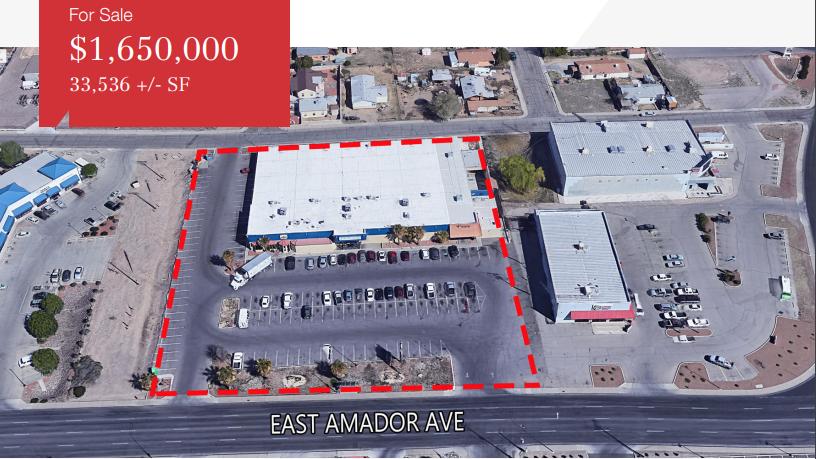
1201 East Amador Avenue Las Cruces, NM 88001
1201 East Amador Avenue Las Cruces, NM 88001
Details & Description
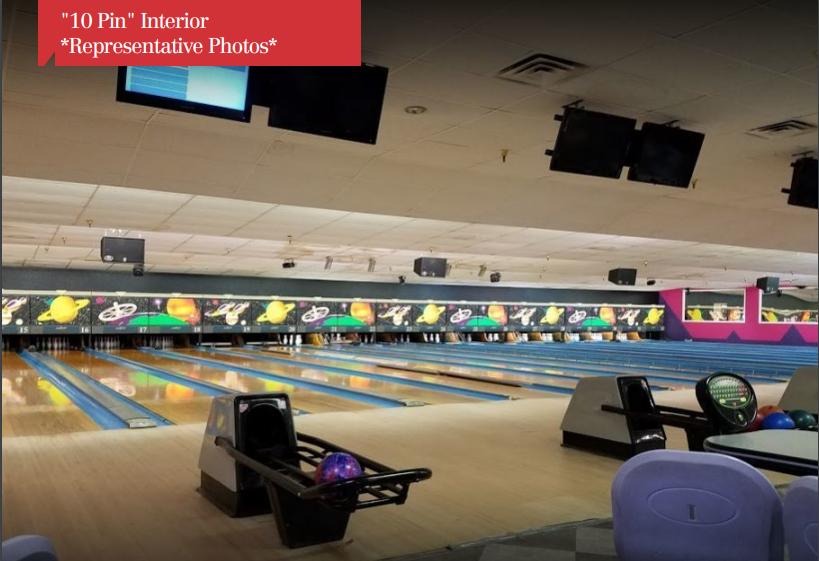
Additional Photos


Listing Agents

Jake Redfearn
O: 575-521-1535
M: 575-635-5895
jake@1stvalley.com
O: 575-521-1535
M: 575-635-5895
jake@1stvalley.com

Jessie Carreon
O: 575-521-1535
jessie@1stvalley.com
O: 575-521-1535
jessie@1stvalley.com
While we strive to provide the most accurate information, all listing information, and demographic data, is provided by third-parties. As such, MyEListing will not be responsible for the accuracy of the information. It is strongly recommended that you verify all information with the listing agent, and any relevant agencies, prior to making any decisions.


