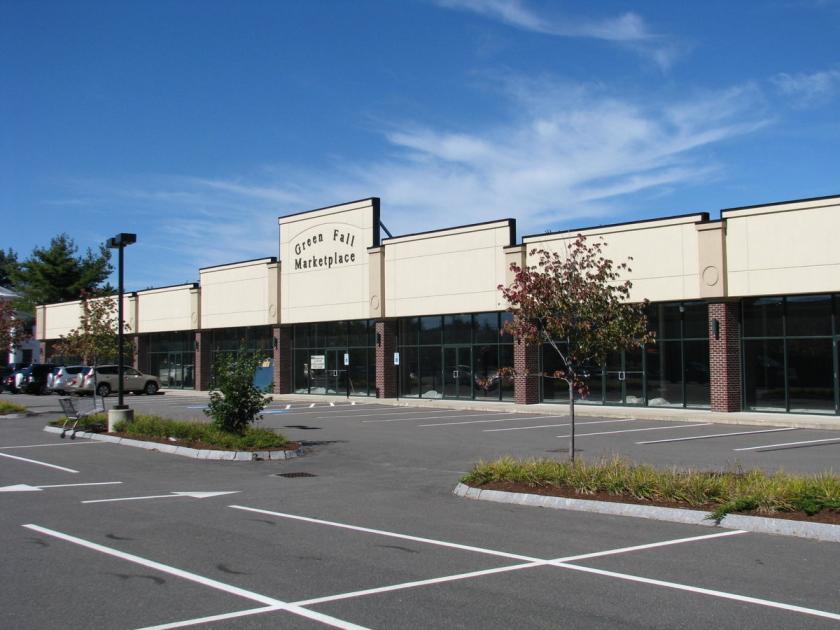
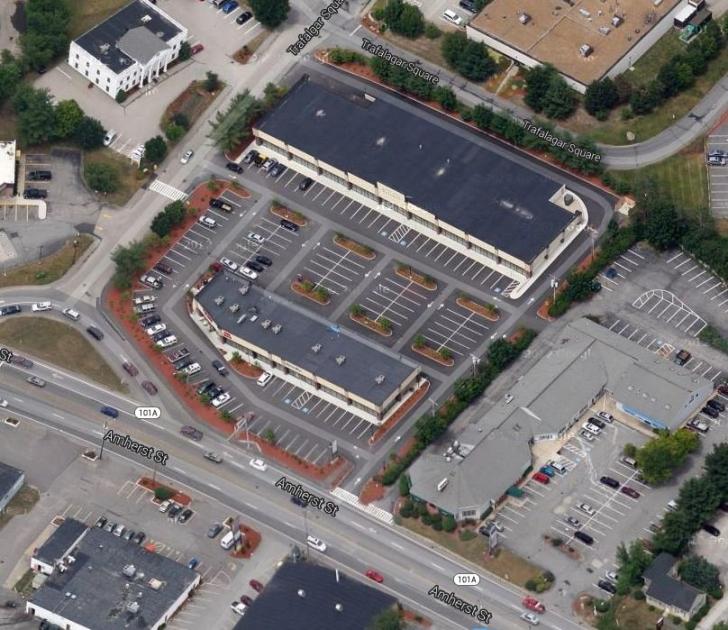
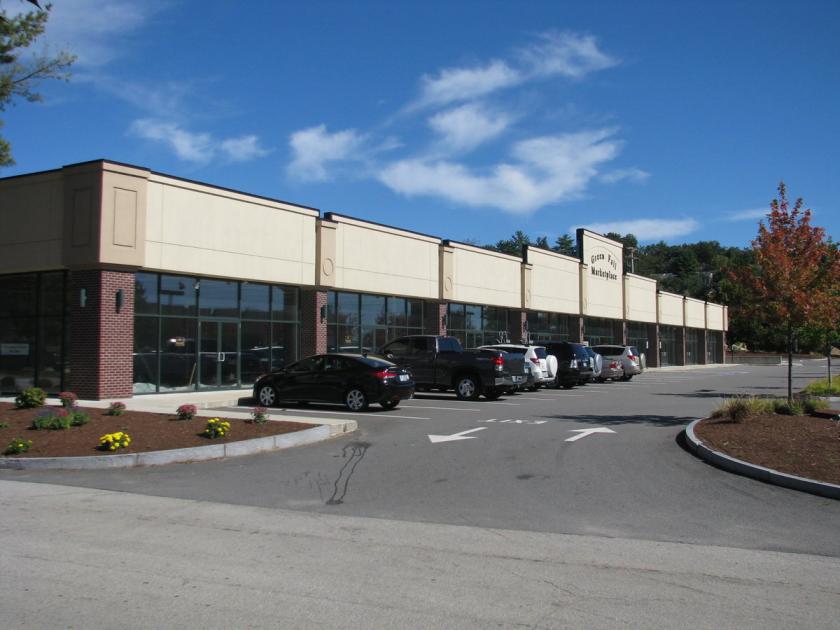
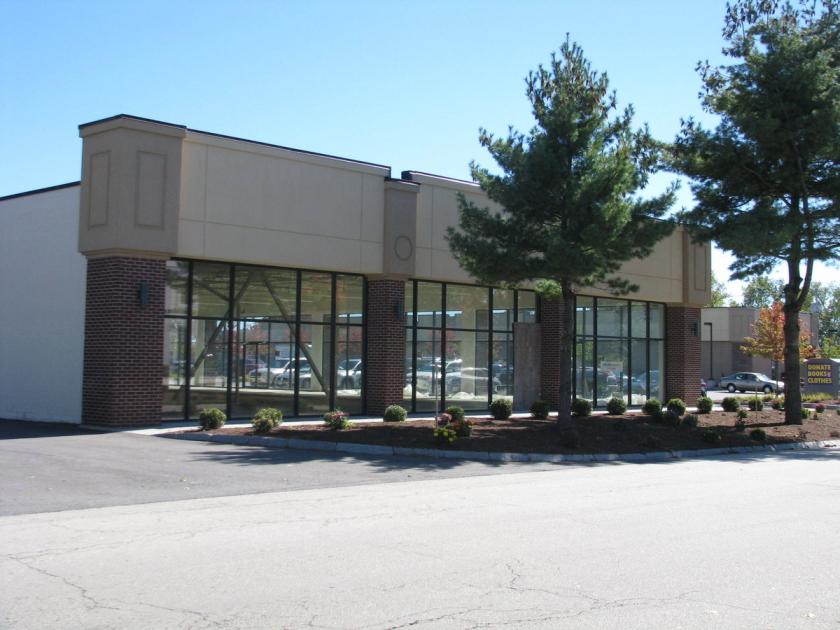
1-Mile | 3-Miles | 5-Miles | ||
---|---|---|---|---|
Total Population | 7,082 | 55,271 | 113,032 | |
Population Median Age | 41 | 40 | 41 | |
Population by Age | 0-9 Yrs | 626 (8%) | 6268 (11%) | 11896 (10%) |
10-19 Yrs | 692 (9%) | 6186 (11%) | 13133 (11%) | |
20-29 Yrs | 1160 (16%) | 7873 (14%) | 14237 (12%) | |
30-39 Yrs | 1012 (14%) | 7665 (13%) | 14998 (13%) | |
40-49 Yrs | 867 (12%) | 6729 (12%) | 14124 (12%) | |
50-59 Yrs | 1155 (16%) | 8045 (14%) | 17825 (15%) | |
60-69 Yrs | 916 (12%) | 6645 (12%) | 14481 (12%) | |
70+ Yrs | 654 (9%) | 5859 (10%) | 12339 (10%) | |
Median HH Income | $92,360 | $70,450 | $81,352 | |
Total Household Income | < 24K | 300 (10%) | 3917 (17%) | 6139 (13%) |
25-49K | 344 (11%) | 4576 (20%) | 7868 (17%) | |
50-74K | 501 (17%) | 3485 (15%) | 6880 (15%) | |
75-99K | 472 (16%) | 3017 (13%) | 6469 (14%) | |
100-199K | 943 (32%) | 5624 (24%) | 13088 (29%) | |
200K+ | 385 (13%) | 2019 (8%) | 4618 (10%) | |
Highest Education Level | No Diploma | 250 | 4229 | 6613 |
Diploma or GED | 1303 | 10674 | 21798 | |
Some College | 893 | 7588 | 15423 | |
Assoc. Degree | 475 | 3421 | 7962 | |
Bachelors Degree | 1509 | 8322 | 18815 | |
Higher Degree | 877 | 4877 | 10470 | |
Total Housing Units | 2,968 | 23,668 | 46,524 | |
--Owner-Occupied | 1,826 | 12,233 | 29,494 | |
--Renter-Occupied | 1,119 | 10,405 | 15,567 | |
Owner-Occupied Values | < 100K | 89 | 742 | 1568 |
100-199K | 317 | 2099 | 4225 | |
200-299K | 712 | 4880 | 11994 | |
300-399K | 561 | 3072 | 7575 | |
400-499K | 61 | 907 | 2541 | |
500K+ | 86 | 533 | 1590 | |
Total Working Age Population | 6,173 | 45,423 | 93,379 | |
In Work Force | 4,572 | 31,481 | 65,611 | |
Not In Work Force | 1,601 | 13,943 | 27,768 | |
Workforce Employed | 4,428 | 29,877 | 62,729 | |
Workforce Unemployed | 129 | 1,491 | 2,759 | |
Civlian Workforce | 4,558 | 31,368 | 65,489 | |
Military Workforce | 14 | 112 | 123 | |
Total Households | 2,945 | 22,639 | 45,061 | |
Family Households | 1,934 | 13,470 | 29,048 | |
Non-Family Households | 1,011 | 9,169 | 16,013 | |
Married Couple | 1,412 | 9,649 | 22,451 | |
Other Family | 522 | 3,820 | 6,597 | |
Married w/Child | 507 | 3,610 | 8,283 | |
Single Male w/Child | 26 | 336 | 754 | |
Single Female w/Child | 120 | 1,578 | 2,537 |
Population Change Last Two Decades - Plus Projection
2000 | % | 2010 | % | 2020 | % | 2030 | |
---|---|---|---|---|---|---|---|
Massachusetts | 6,349,097 | +3 | 6,547,629 | +6 | 6,933,887 | +4 | 7,225,472 |
Middlesex County | 1,465,396 | +3 | 1,503,085 | +7 | 1,613,961 | +5 | 1,686,641 |
Worcester County | 750,963 | +6 | 798,552 | +5 | 838,577 | +5 | 876,966 |
New Hampshire | 1,235,786 | +7 | 1,316,470 | +3 | 1,349,908 | +4 | 1,402,878 |
Hillsborough County | 380,841 | +5 | 400,721 | +2 | 409,478 | +4 | 424,492 |
Rockingham County | 277,359 | +6 | 295,223 | +4 | 307,013 | +5 | 321,441 |
Total Working Age Population:
Total Households:
Total Working Age Population:
Total Households:
Total Working Age Population:
Total Households: