In 2020, Ridgefield saw a 38-percent increase in new single-family residential building permits submitted and a 77-percent increase in single-family residential building permits issued.
Ridgefield has been the fastest growing city in the State of Washington 3 times in the last 10 years.
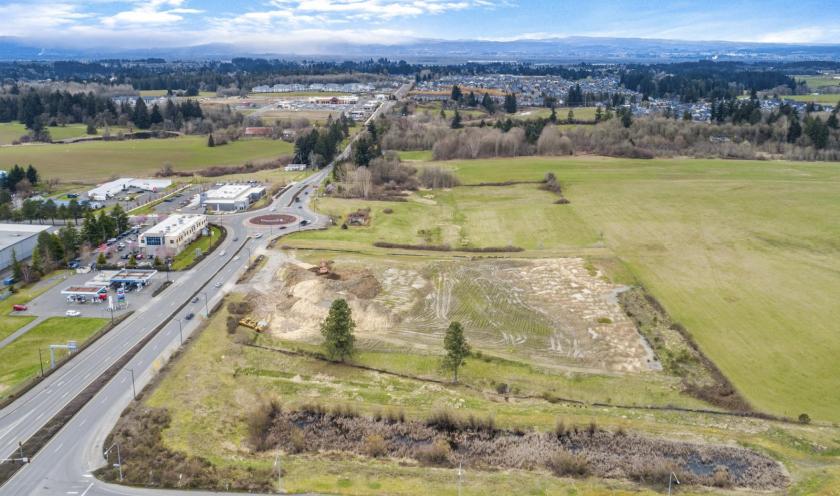
Two forty-foot curb cuts provide the site with good access via the area's primary commercial arterial.
The site is located just five miles north of the convergence of I-5 and I-205, offering the site good access to the wider Portland Metro Area.
High average household income within 5 miles is over $130,000.
The area boasts several wineries, a public golf course, the extremely popular Clark County Fairgrounds and is home to the Ridgefield National Wildlife Refuge.
No part of this information may be copied, reproduced, repurposed, or screen-captured for any commercial purpose without prior written authorization from MyEListing.
While we strive to provide the most accurate information, all listing information, and demographic data, is provided by third-parties. As such, MyEListing will not be responsible for the accuracy of the information. It is strongly recommended that you verify all information with the listing agent, and any relevant agencies, prior to making any decisions.
What kind of Land is the propery at 8307 Pioneer Street?
The property at 8307 Pioneer Street Ridgefield, WA 98642 is listed as a Retail Pad Site Land property
What is the population within 1 mile of 8307 Pioneer Street in Ridgefield?
The population within 1 mile of 8307 Pioneer Street Ridgefield, WA 98642 is 622 people.
Who do I contact for questions about 8307 Pioneer Street?
You should contact the listing agent,
George Macoubray, for any details regarding this commercial listing.