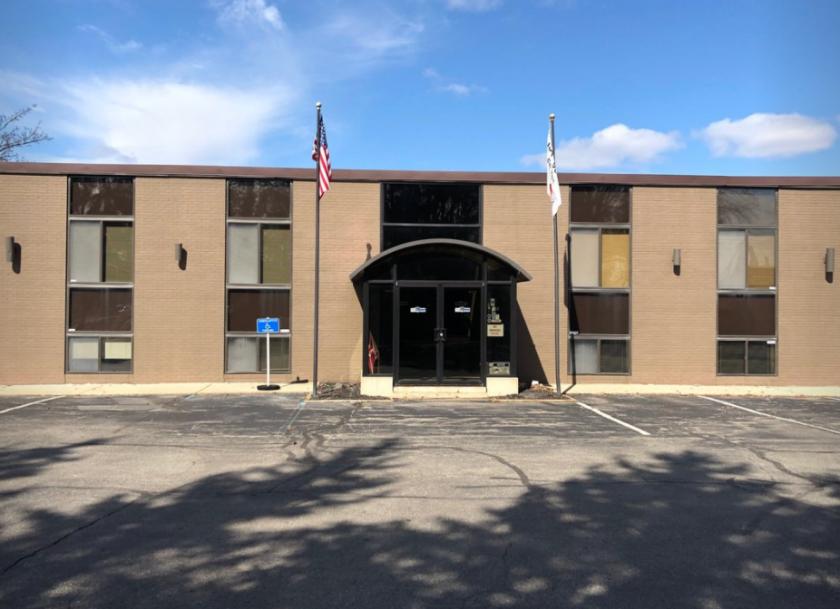
Office Space
2020 Nelson Avenue Southeast Grand Rapids, MI 49507
2020 Nelson Avenue Southeast Grand Rapids, MI 49507
Details & Description
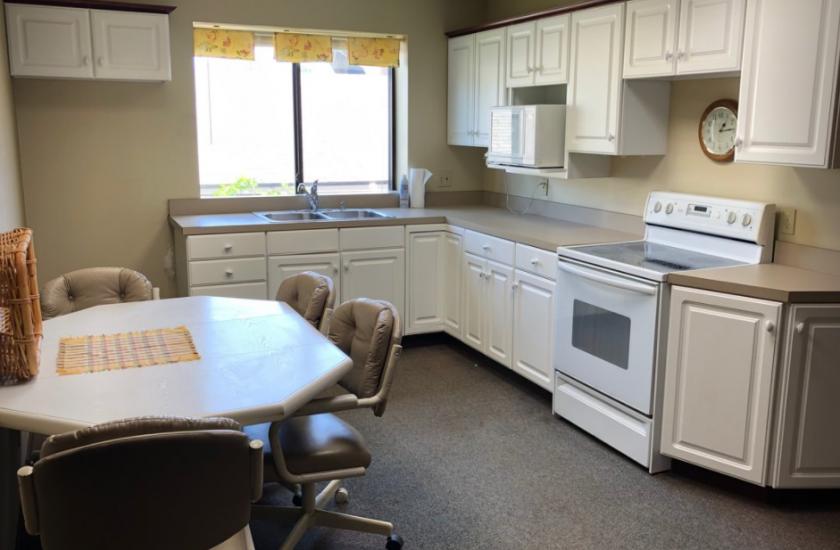
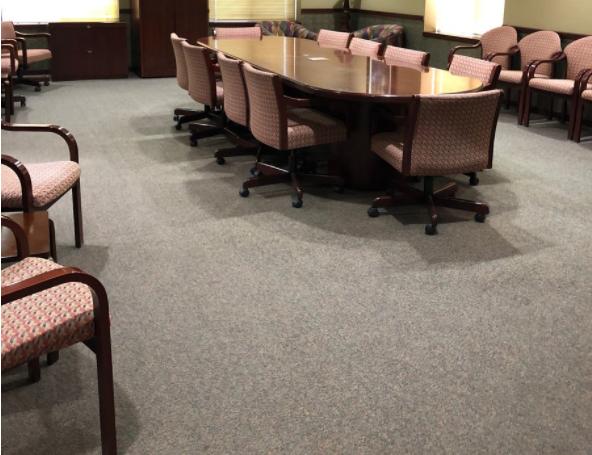
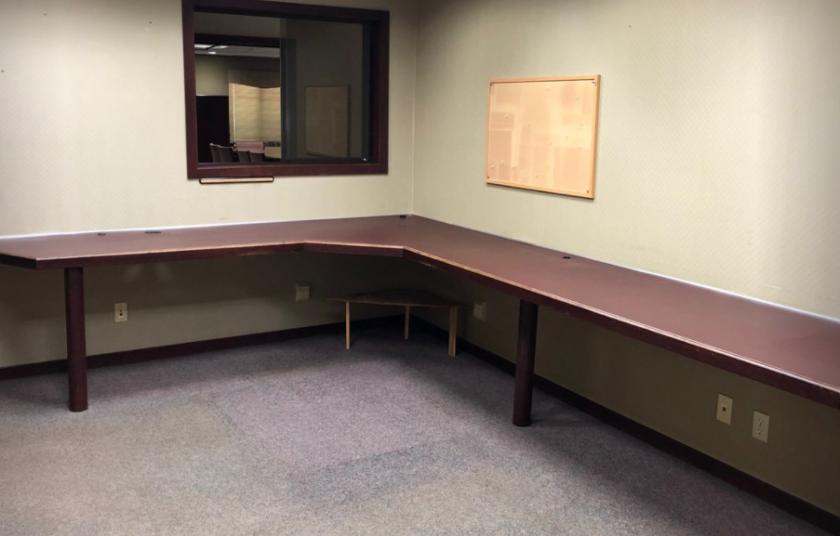
Additional Photos
Listing Agents

Hillary Taatjes Woznick
O: 616-242-1113
M: 616-862-1179
hillary@naiwwm.com
O: 616-242-1113
M: 616-862-1179
hillary@naiwwm.com

Douglas Taatjes
O: 616-776-0100
M: 616-292-1828
dougt@naiwwm.com
O: 616-776-0100
M: 616-292-1828
dougt@naiwwm.com
While we strive to provide the most accurate information, all listing information, and demographic data, is provided by third-parties. As such, MyEListing will not be responsible for the accuracy of the information. It is strongly recommended that you verify all information with the listing agent, and any relevant agencies, prior to making any decisions.


