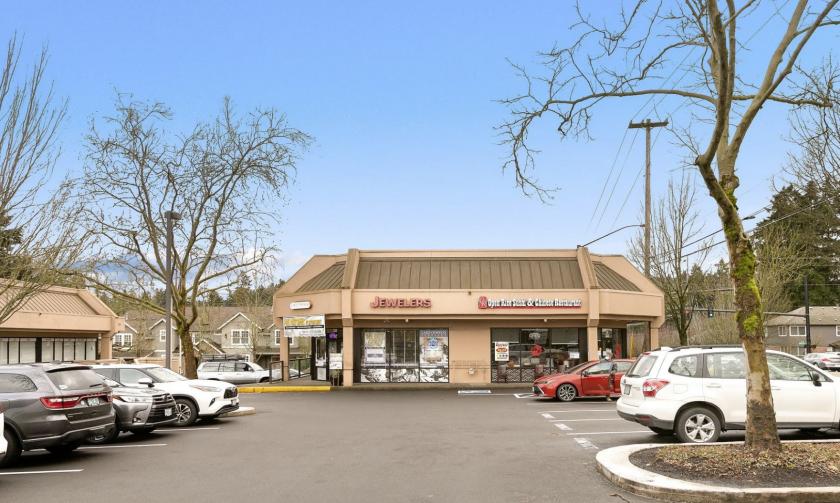
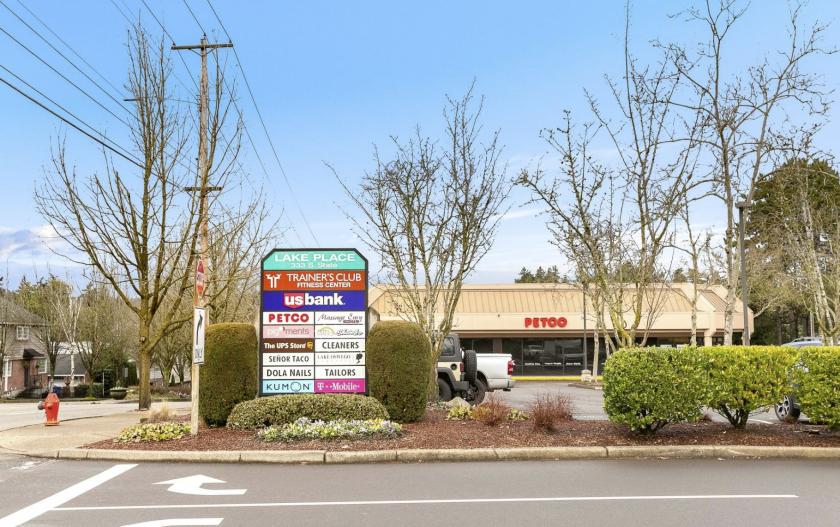
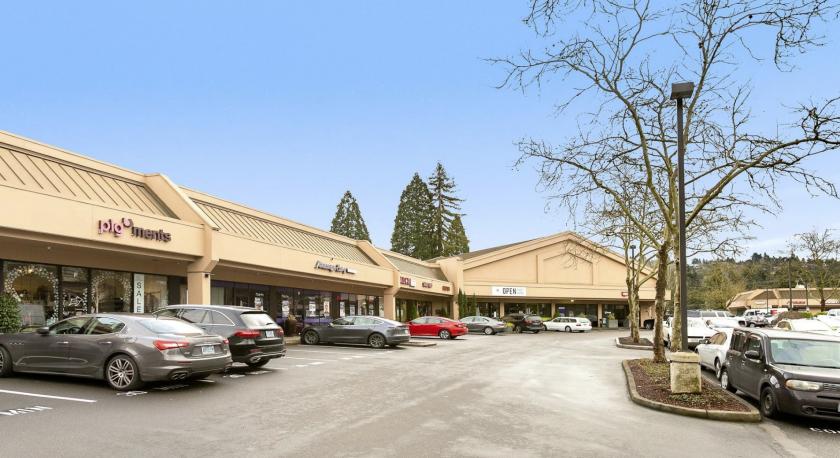
1-Mile | 3-Miles | 5-Miles | ||
---|---|---|---|---|
Total Population | 10,160 | 81,785 | 268,573 | |
Population Median Age | 47 | 43 | 41 | |
Population by Age | 0-9 Yrs | 760 (7%) | 7711 (9%) | 29879 (11%) |
10-19 Yrs | 1112 (10%) | 9806 (11%) | 30971 (11%) | |
20-29 Yrs | 906 (8%) | 8983 (10%) | 31871 (11%) | |
30-39 Yrs | 742 (7%) | 9013 (11%) | 38595 (14%) | |
40-49 Yrs | 1426 (14%) | 10951 (13%) | 36080 (13%) | |
50-59 Yrs | 1628 (16%) | 11817 (14%) | 35846 (13%) | |
60-69 Yrs | 1818 (17%) | 12022 (14%) | 35110 (13%) | |
70+ Yrs | 1770 (17%) | 11481 (14%) | 30221 (11%) | |
Median HH Income | $95,017 | $87,088 | $82,530 | |
Total Household Income | < 24K | 505 (10%) | 4218 (12%) | 14794 (13%) |
25-49K | 690 (14%) | 5629 (16%) | 17974 (16%) | |
50-74K | 622 (13%) | 5293 (15%) | 17787 (16%) | |
75-99K | 603 (13%) | 3952 (11%) | 14914 (13%) | |
100-199K | 1307 (28%) | 9261 (27%) | 29266 (26%) | |
200K+ | 873 (18%) | 5750 (16%) | 15360 (13%) | |
Highest Education Level | No Diploma | 207 | 2914 | 9607 |
Diploma or GED | 847 | 8140 | 29623 | |
Some College | 1377 | 11605 | 40169 | |
Assoc. Degree | 372 | 3836 | 13440 | |
Bachelors Degree | 2668 | 19567 | 60103 | |
Higher Degree | 2348 | 13946 | 40390 | |
Total Housing Units | 4,892 | 35,959 | 115,262 | |
--Owner-Occupied | 3,201 | 24,198 | 71,596 | |
--Renter-Occupied | 1,400 | 9,906 | 38,499 | |
Owner-Occupied Values | < 100K | 28 | 836 | 2376 |
100-199K | 64 | 998 | 3177 | |
200-299K | 351 | 3132 | 10427 | |
300-399K | 519 | 4547 | 15341 | |
400-499K | 316 | 3677 | 12983 | |
500K+ | 1923 | 11008 | 27291 | |
Total Working Age Population | 8,655 | 68,043 | 219,547 | |
In Work Force | 5,212 | 42,999 | 145,863 | |
Not In Work Force | 3,443 | 25,044 | 73,685 | |
Workforce Employed | 5,101 | 41,124 | 138,984 | |
Workforce Unemployed | 111 | 1,834 | 6,785 | |
Civlian Workforce | 5,212 | 42,958 | 145,769 | |
Military Workforce | 0 | 42 | 94 | |
Total Households | 4,601 | 34,104 | 110,095 | |
Family Households | 2,919 | 21,866 | 67,835 | |
Non-Family Households | 1,682 | 12,237 | 42,260 | |
Married Couple | 2,432 | 18,199 | 54,453 | |
Other Family | 487 | 3,667 | 13,382 | |
Married w/Child | 772 | 6,905 | 21,702 | |
Single Male w/Child | 84 | 518 | 1,843 | |
Single Female w/Child | 176 | 1,267 | 5,660 |
Population Change Last Two Decades - Plus Projection
2000 | % | 2010 | % | 2020 | % | 2030 | |
---|---|---|---|---|---|---|---|
Oregon | 3,421,399 | +12 | 3,831,074 | +11 | 4,264,810 | +11 | 4,727,438 |
Clackamas County | 338,391 | +11 | 375,992 | +14 | 428,860 | +14 | 490,011 |
Multnomah County | 660,486 | +11 | 735,334 | +12 | 822,675 | +10 | 906,904 |
Washington County | 445,342 | +19 | 529,710 | +17 | 619,337 | +16 | 718,633 |
Total Working Age Population:
Total Households:
Total Working Age Population:
Total Households:
Total Working Age Population:
Total Households: