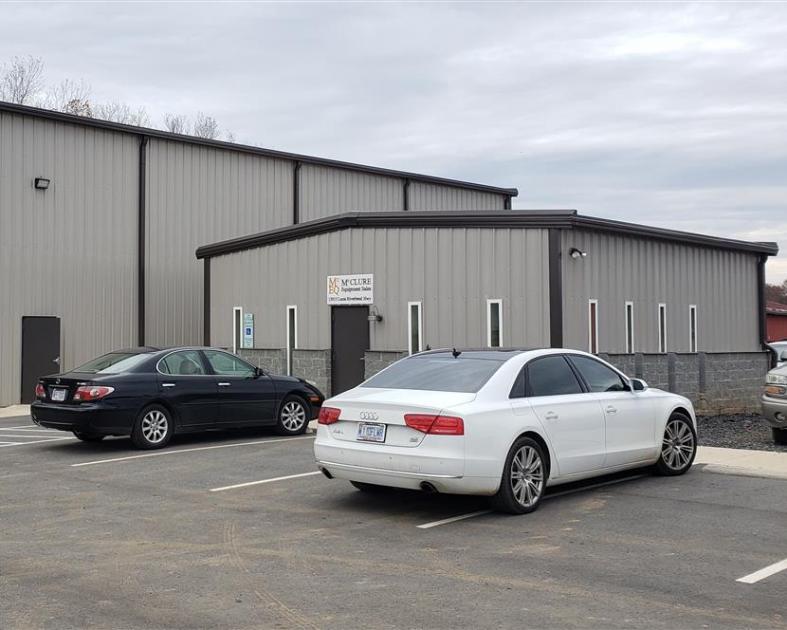
Industrial Properties
13915 Lucia Riverbend Highway Mount Holly, NC 28120
13915 Lucia Riverbend Highway Mount Holly, NC 28120
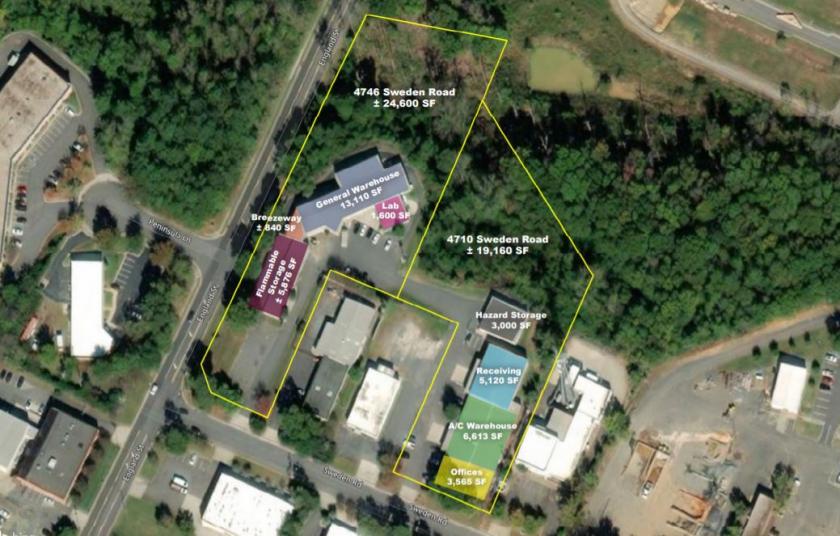
Details & Description
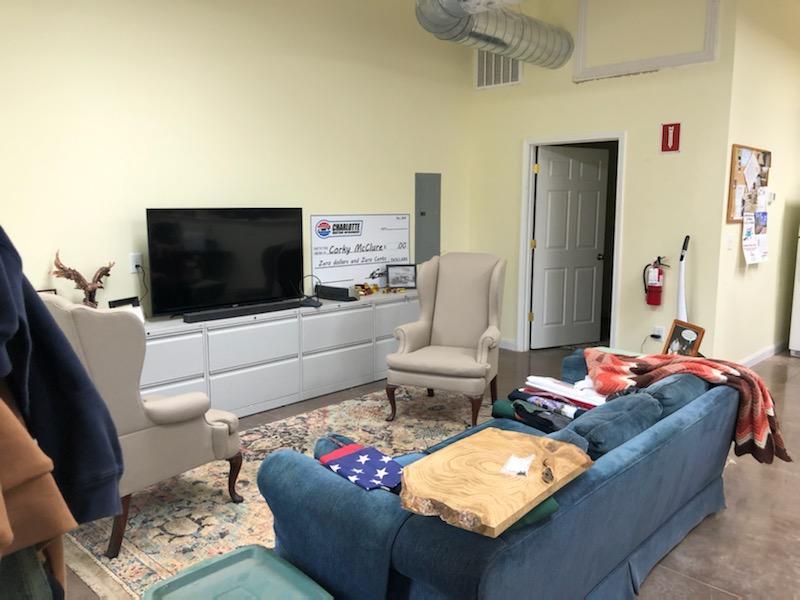
Additional Photos

Listing Agents

Jay Vaughn
O: 704-632-7627
M: 704-488-1400
jvaughn@srenc.com
O: 704-632-7627
M: 704-488-1400
jvaughn@srenc.com
While we strive to provide the most accurate information, all listing information, and demographic data, is provided by third-parties. As such, MyEListing will not be responsible for the accuracy of the information. It is strongly recommended that you verify all information with the listing agent, and any relevant agencies, prior to making any decisions.


