Industrial Properties
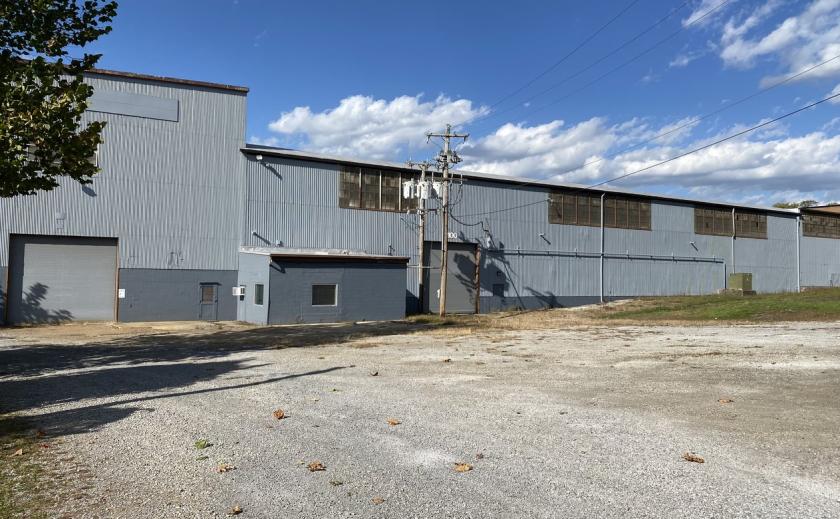
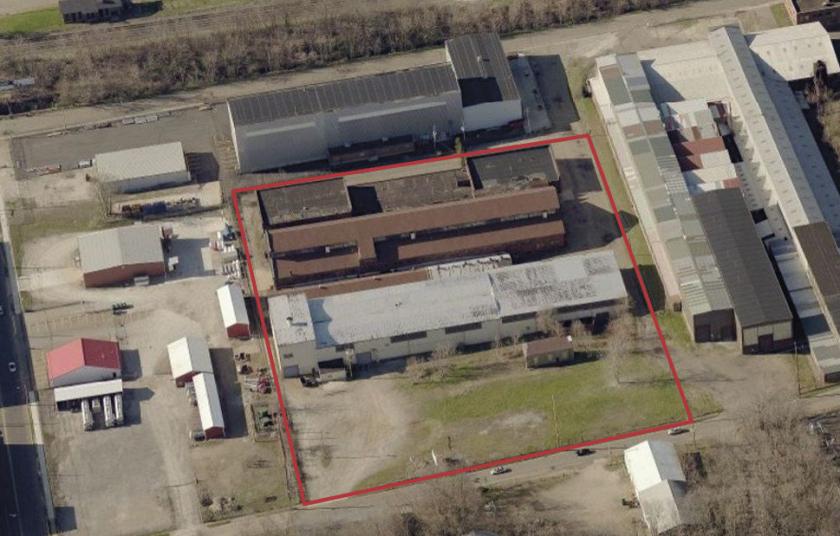
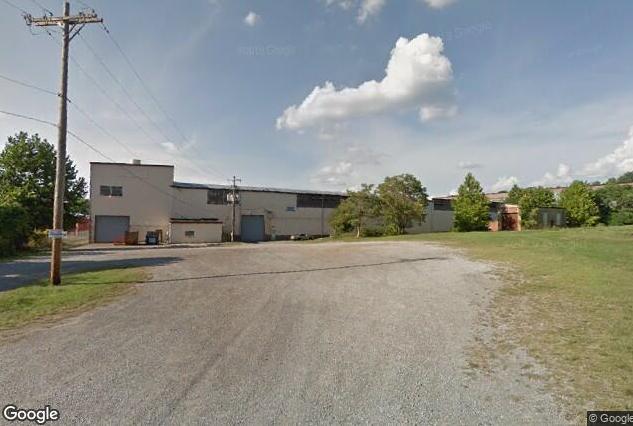
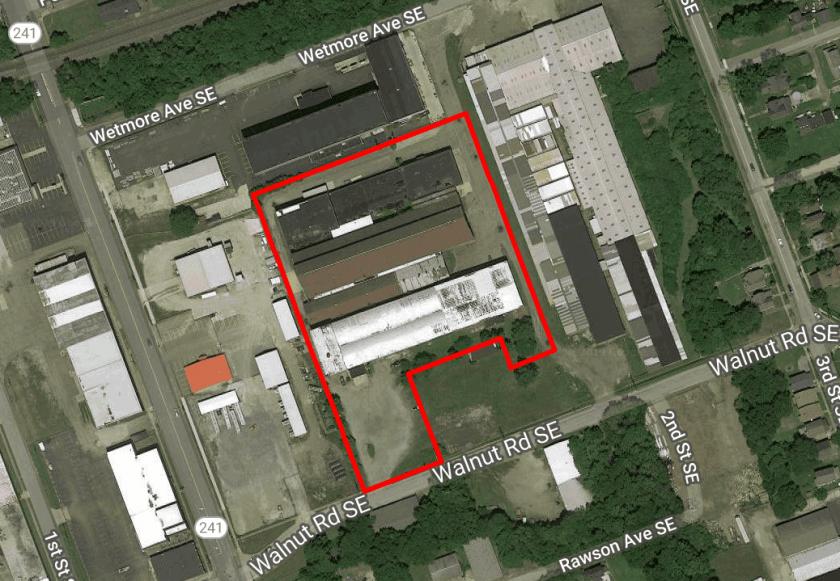
201 Wetmore Avenue Southeast Massillon, OH 44646
201 Wetmore Avenue Southeast Massillon, OH 44646
Details & Description
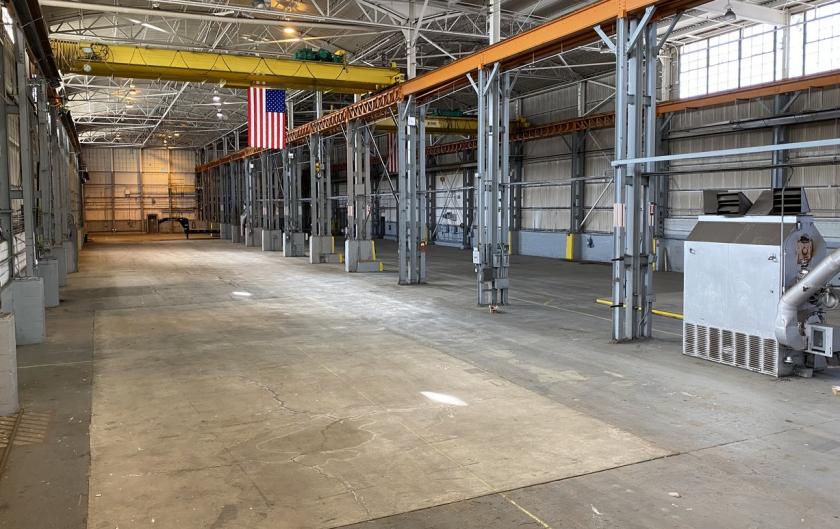
Additional Photos
Listing Agents

Greg Luntz
O: 330-526-6229
M: 330-936-3665
greg@naispring.com
O: 330-526-6229
M: 330-936-3665
greg@naispring.com

Steve Marcelli
O: 330-327-5834
M: 330-327-5834
steve@naispring.com
O: 330-327-5834
M: 330-327-5834
steve@naispring.com
While we strive to provide the most accurate information, all listing information, and demographic data, is provided by third-parties. As such, MyEListing will not be responsible for the accuracy of the information. It is strongly recommended that you verify all information with the listing agent, and any relevant agencies, prior to making any decisions.


