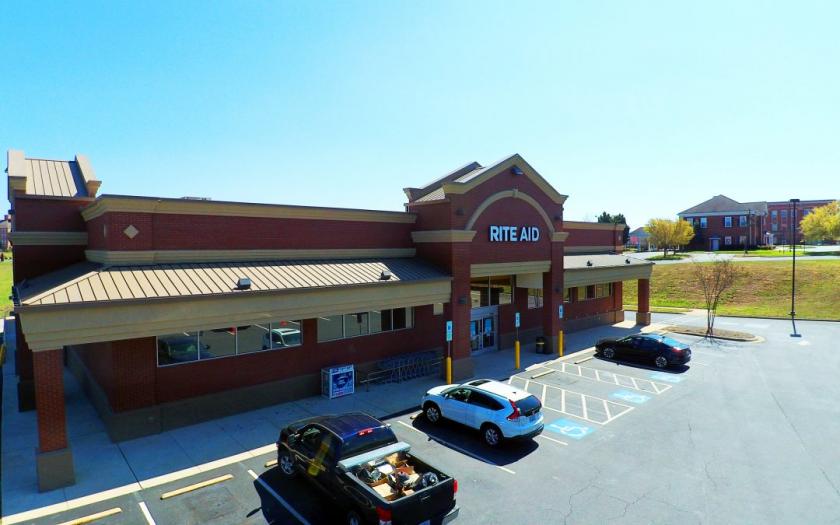
• Former Rite Aid with income term remaining.
• Absolute Net Lease | No Landlord Responsibilities.
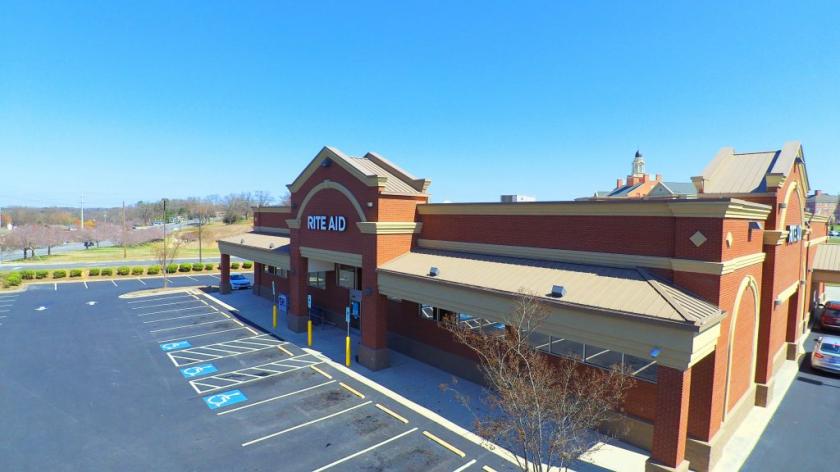
• Prototypical Freestanding Building with Drive-Thru.
• Improved Credit – Lease Guaranteed by Walgreen’s Co Investment Grade Tenant – Standard & Poor’s Credit Rating – “BBB”.
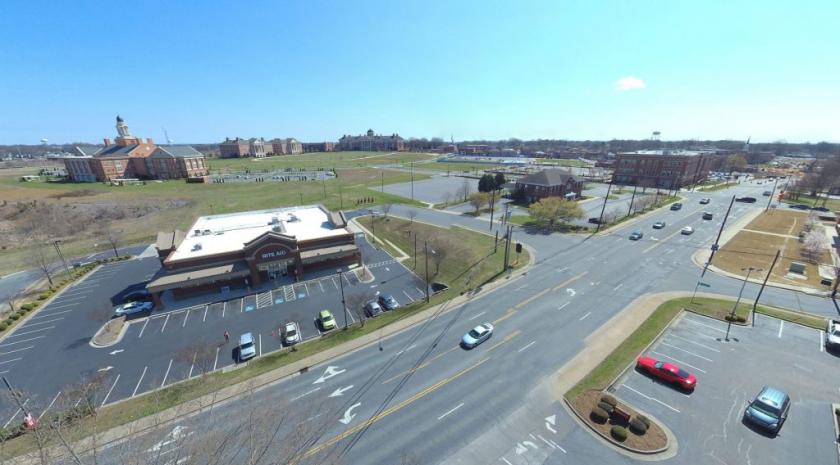
• Site Located adjacent to North Carolina Research Campus and 3.6 Miles from Shaw University.
• Population Within a 5-Mile Radius Exceeds 75,000 people.
• Household Income Within a 3-Mile Radius: $60,000+.
• Charlotte MSA | Site is 27 miles north of Charlotte.
• Nearest Walgreen’s to subject site is 2 Miles.
• Neighboring National Retailers Include: Hardee’s, Food Lion, Pizza Hut, Subway, Wells Fargo, and more.
No part of this information may be copied, reproduced, repurposed, or screen-captured for any commercial purpose without prior written authorization from MyEListing.
While we strive to provide the most accurate information, all listing information, and demographic data, is provided by third-parties. As such, MyEListing will not be responsible for the accuracy of the information. It is strongly recommended that you verify all information with the listing agent, and any relevant agencies, prior to making any decisions.
What is the asking price for 135 Dale Earnhardt Boulevard in Kannapolis?
The asking price for 135 Dale Earnhardt Boulevard is $3,499,000
What is the building size of this Retail property in Kannapolis, NC?
The size of the building/unit at 135 Dale Earnhardt Boulevard in Kannapolis is 13,813 square feet
How much land does the Kannapolis, NC property at 135 Dale Earnhardt Boulevard include?
135 Dale Earnhardt Boulevard in Kannapolis includes 2.080 acres of land
What kind of Retail is the propery at 135 Dale Earnhardt Boulevard?
The property at 135 Dale Earnhardt Boulevard Kannapolis, NC 28081 is listed as a Free Standing Building Retail property
What is the population within 1 mile of 135 Dale Earnhardt Boulevard in Kannapolis?
The population within 1 mile of 135 Dale Earnhardt Boulevard Kannapolis, NC 28081 is 7,014 people.
Who do I contact for questions about 135 Dale Earnhardt Boulevard?
You should contact the listing agent,
Billy Cooper, for any details regarding this commercial listing.