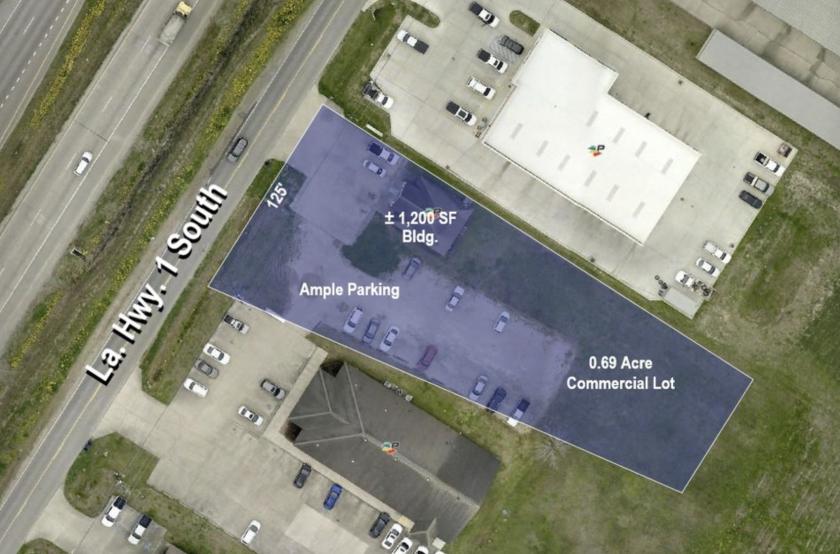
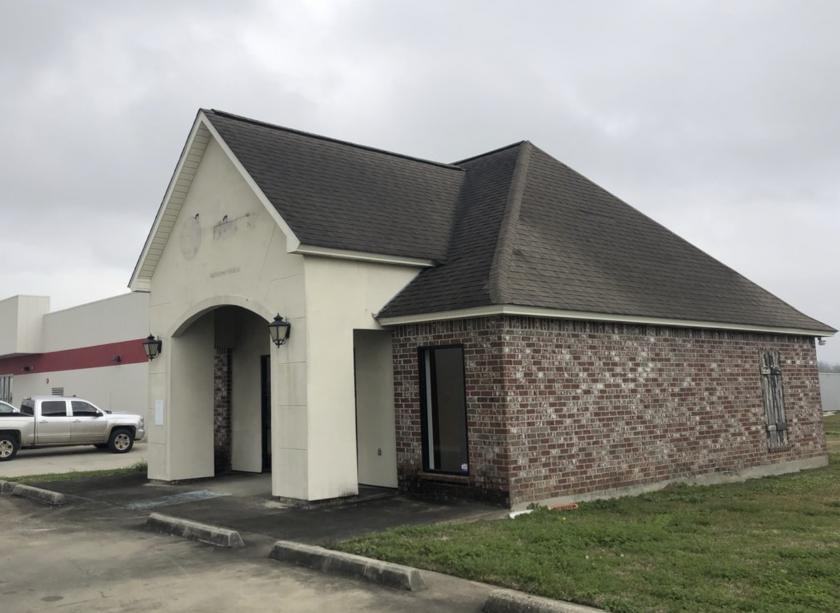
1-Mile | 3-Miles | 5-Miles | ||
---|---|---|---|---|
Total Population | 1,505 | 32,242 | 82,420 | |
Population Median Age | 39 | 34 | 35 | |
Population by Age | 0-9 Yrs | 159 (10%) | 2830 (8%) | 7736 (9%) |
10-19 Yrs | 250 (16%) | 5538 (17%) | 12028 (14%) | |
20-29 Yrs | 106 (7%) | 9087 (28%) | 22626 (27%) | |
30-39 Yrs | 225 (14%) | 3698 (11%) | 9566 (11%) | |
40-49 Yrs | 212 (14%) | 2798 (8%) | 7591 (9%) | |
50-59 Yrs | 264 (17%) | 3086 (9%) | 8167 (9%) | |
60-69 Yrs | 160 (10%) | 3123 (9%) | 8547 (10%) | |
70+ Yrs | 128 (8%) | 2082 (6%) | 6159 (7%) | |
Median HH Income | $63,250 | $37,704 | $43,688 | |
Total Household Income | < 24K | 97 (16%) | 4446 (36%) | 10914 (34%) |
25-49K | 118 (19%) | 2755 (22%) | 6185 (19%) | |
50-74K | 121 (20%) | 1930 (15%) | 4332 (13%) | |
75-99K | 51 (8%) | 812 (6%) | 2517 (7%) | |
100-199K | 192 (31%) | 1736 (14%) | 5465 (17%) | |
200K+ | 25 (4%) | 641 (5%) | 2245 (7%) | |
Highest Education Level | No Diploma | 118 | 2439 | 5470 |
Diploma or GED | 372 | 5189 | 11758 | |
Some College | 166 | 3189 | 7993 | |
Assoc. Degree | 74 | 1082 | 2091 | |
Bachelors Degree | 226 | 3437 | 11161 | |
Higher Degree | 93 | 2528 | 8722 | |
Total Housing Units | 663 | 16,347 | 40,637 | |
--Owner-Occupied | 441 | 5,131 | 14,804 | |
--Renter-Occupied | 163 | 7,188 | 16,854 | |
Owner-Occupied Values | < 100K | 37 | 1032 | 2888 |
100-199K | 110 | 1800 | 3480 | |
200-299K | 199 | 1528 | 4004 | |
300-399K | 80 | 510 | 2016 | |
400-499K | 14 | 132 | 1043 | |
500K+ | 1 | 129 | 1372 | |
Total Working Age Population | 1,263 | 28,292 | 71,001 | |
In Work Force | 819 | 17,511 | 44,741 | |
Not In Work Force | 444 | 10,781 | 26,260 | |
Workforce Employed | 780 | 15,729 | 40,856 | |
Workforce Unemployed | 39 | 1,763 | 3,804 | |
Civlian Workforce | 819 | 17,492 | 44,660 | |
Military Workforce | 0 | 19 | 81 | |
Total Households | 604 | 12,319 | 31,658 | |
Family Households | 403 | 5,635 | 14,756 | |
Non-Family Households | 202 | 6,685 | 16,902 | |
Married Couple | 314 | 3,343 | 9,394 | |
Other Family | 89 | 2,292 | 5,362 | |
Married w/Child | 134 | 994 | 3,177 | |
Single Male w/Child | 10 | 146 | 389 | |
Single Female w/Child | 24 | 929 | 2,038 |
Population Change Last Two Decades - Plus Projection
2000 | % | 2010 | % | 2020 | % | 2030 | |
---|---|---|---|---|---|---|---|
Louisiana | 4,468,976 | +1 | 4,533,372 | +1 | 4,588,310 | +5 | 4,813,420 |
East Baton Rouge Parish | 412,852 | +7 | 440,171 | -3 | 426,380 | -1 | 421,500 |
Iberville Parish | 33,320 | 0 | 33,387 | -17 | 27,830 | -11 | 24,640 |
St. Martin Parish | 48,583 | +7 | 52,160 | +6 | 55,520 | +3 | 57,000 |
West Baton Rouge Parish | 21,601 | +10 | 23,788 | -7 | 22,220 | -5 | 21,070 |
Total Working Age Population:
Total Households:
Total Working Age Population:
Total Households:
Total Working Age Population:
Total Households: