Industrial Properties
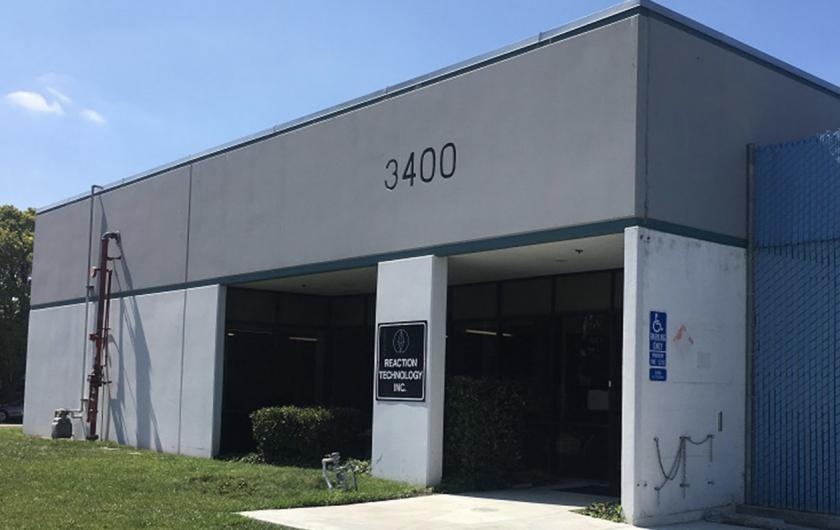
3400 Bassett Street Santa Clara, CA 95054
3400 Bassett Street Santa Clara, CA 95054
Details & Description
Listing Agents

Robert Badagliacco
O: 408-600-3488
M: 408-568-3726
RBADAGLIACCO@CRESA.COM
O: 408-600-3488
M: 408-568-3726
RBADAGLIACCO@CRESA.COM
While we strive to provide the most accurate information, all listing information, and demographic data, is provided by third-parties. As such, MyEListing will not be responsible for the accuracy of the information. It is strongly recommended that you verify all information with the listing agent, and any relevant agencies, prior to making any decisions.