Office Space
275 Canal Street New York, NY 10013
275 Canal Street New York, NY 10013

Details & Description
Property Highlights
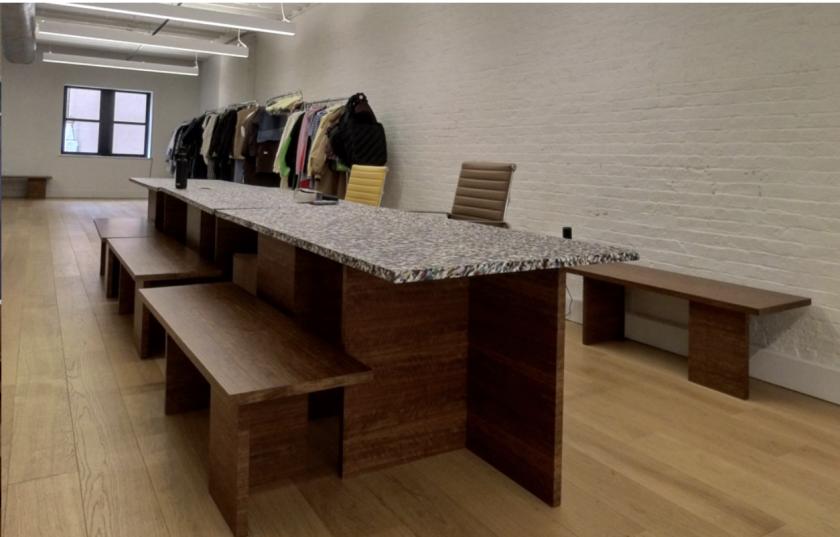
• Entire 4th Floor
• Entire 4th Floor
Listing Agents

Nick Markel
O: 212-687-4501
M: 914-980-3634
NMARKEL@CRESA.COM
O: 212-687-4501
M: 914-980-3634
NMARKEL@CRESA.COM
While we strive to provide the most accurate information, all listing information, and demographic data, is provided by third-parties. As such, MyEListing will not be responsible for the accuracy of the information. It is strongly recommended that you verify all information with the listing agent, and any relevant agencies, prior to making any decisions.