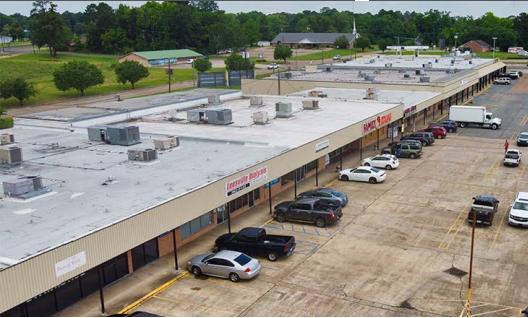
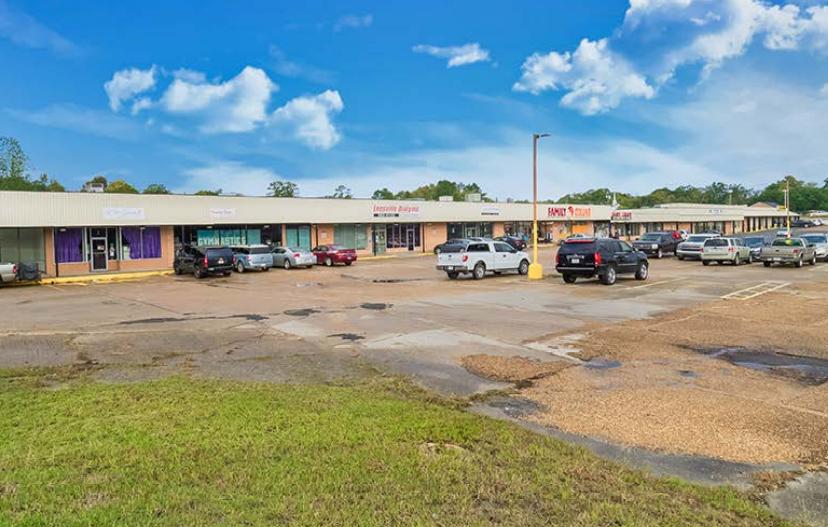
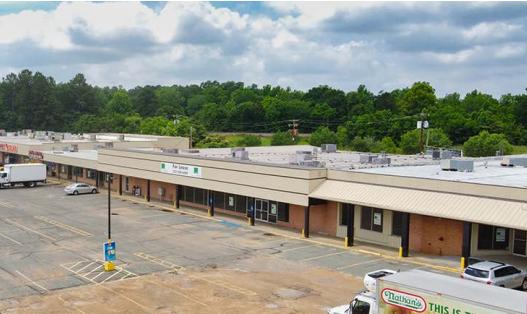
1-Mile | 3-Miles | 5-Miles | ||
---|---|---|---|---|
Total Population | 2,063 | 8,605 | 14,659 | |
Population Median Age | 38 | 37 | 35 | |
Population by Age | 0-9 Yrs | 267 (12%) | 1217 (14%) | 2108 (14%) |
10-19 Yrs | 196 (9%) | 986 (11%) | 1649 (11%) | |
20-29 Yrs | 352 (17%) | 1422 (16%) | 3164 (21%) | |
30-39 Yrs | 280 (13%) | 1233 (14%) | 2024 (13%) | |
40-49 Yrs | 295 (14%) | 955 (11%) | 1568 (10%) | |
50-59 Yrs | 249 (12%) | 1051 (12%) | 1569 (10%) | |
60-69 Yrs | 204 (9%) | 904 (10%) | 1368 (9%) | |
70+ Yrs | 219 (10%) | 838 (9%) | 1209 (8%) | |
Median HH Income | $32,370 | $37,187 | $40,326 | |
Total Household Income | < 24K | 378 (41%) | 1225 (35%) | 1772 (30%) |
25-49K | 236 (25%) | 876 (25%) | 1640 (28%) | |
50-74K | 144 (15%) | 601 (17%) | 1066 (18%) | |
75-99K | 85 (9%) | 328 (9%) | 560 (9%) | |
100-199K | 58 (6%) | 351 (10%) | 696 (11%) | |
200K+ | 10 (1%) | 53 (1%) | 118 (2%) | |
Highest Education Level | No Diploma | 256 | 895 | 1226 |
Diploma or GED | 507 | 2055 | 3294 | |
Some College | 298 | 1297 | 2109 | |
Assoc. Degree | 116 | 419 | 664 | |
Bachelors Degree | 133 | 654 | 1271 | |
Higher Degree | 68 | 318 | 567 | |
Total Housing Units | 1,255 | 4,485 | 7,512 | |
--Owner-Occupied | 384 | 1,753 | 2,771 | |
--Renter-Occupied | 526 | 1,682 | 3,081 | |
Owner-Occupied Values | < 100K | 164 | 798 | 1119 |
100-199K | 183 | 645 | 958 | |
200-299K | 18 | 226 | 540 | |
300-399K | 13 | 54 | 98 | |
400-499K | 5 | 15 | 23 | |
500K+ | 0 | 14 | 33 | |
Total Working Age Population | 1,690 | 6,773 | 11,527 | |
In Work Force | 896 | 3,748 | 6,751 | |
Not In Work Force | 794 | 3,025 | 4,776 | |
Workforce Employed | 757 | 3,163 | 5,184 | |
Workforce Unemployed | 74 | 344 | 543 | |
Civlian Workforce | 831 | 3,507 | 5,727 | |
Military Workforce | 66 | 241 | 1,025 | |
Total Households | 909 | 3,434 | 5,852 | |
Family Households | 437 | 1,975 | 3,683 | |
Non-Family Households | 472 | 1,459 | 2,169 | |
Married Couple | 266 | 1,251 | 2,613 | |
Other Family | 171 | 724 | 1,070 | |
Married w/Child | 79 | 414 | 1,012 | |
Single Male w/Child | 16 | 57 | 87 | |
Single Female w/Child | 90 | 377 | 528 |
Population Change Last Two Decades - Plus Projection
2000 | % | 2010 | % | 2020 | % | 2030 | |
---|---|---|---|---|---|---|---|
Louisiana | 4,468,976 | +1 | 4,533,372 | +1 | 4,588,310 | +5 | 4,813,420 |
Sabine Parish | 23,459 | +3 | 24,233 | +6 | 25,630 | +7 | 27,300 |
Vernon Parish | 52,531 | 0 | 52,334 | -21 | 41,510 | -8 | 38,190 |
Total Working Age Population:
Total Households:
Total Working Age Population:
Total Households:
Total Working Age Population:
Total Households: