Specialty Real Estate
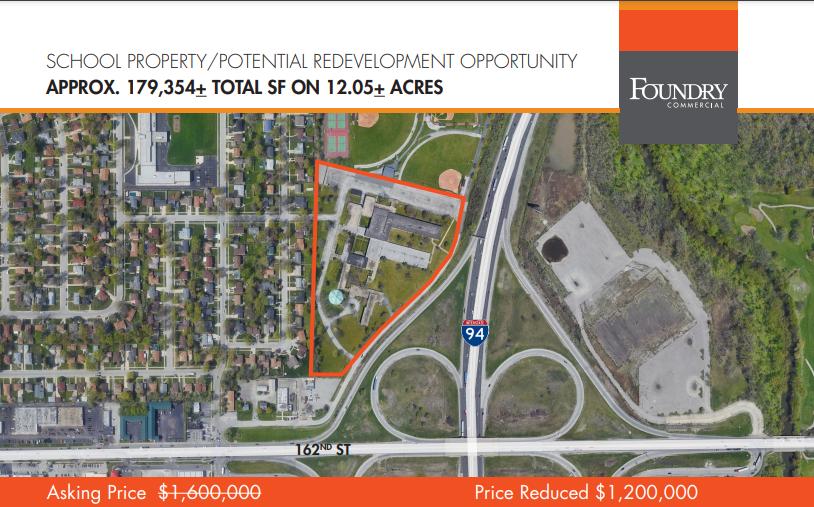
16100 Seton Road South Holland, IL 60473
16100 Seton Road South Holland, IL 60473
Details & Description
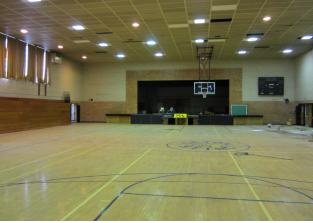
Additional Photos


Listing Agents

Matt Messier
O: 407-540-7718
matt.messier@foundrycommercial.com
O: 407-540-7718
matt.messier@foundrycommercial.com
While we strive to provide the most accurate information, all listing information, and demographic data, is provided by third-parties. As such, MyEListing will not be responsible for the accuracy of the information. It is strongly recommended that you verify all information with the listing agent, and any relevant agencies, prior to making any decisions.


