±3,765 - 42,400 SF of Class B flex and warehouse space available for lease
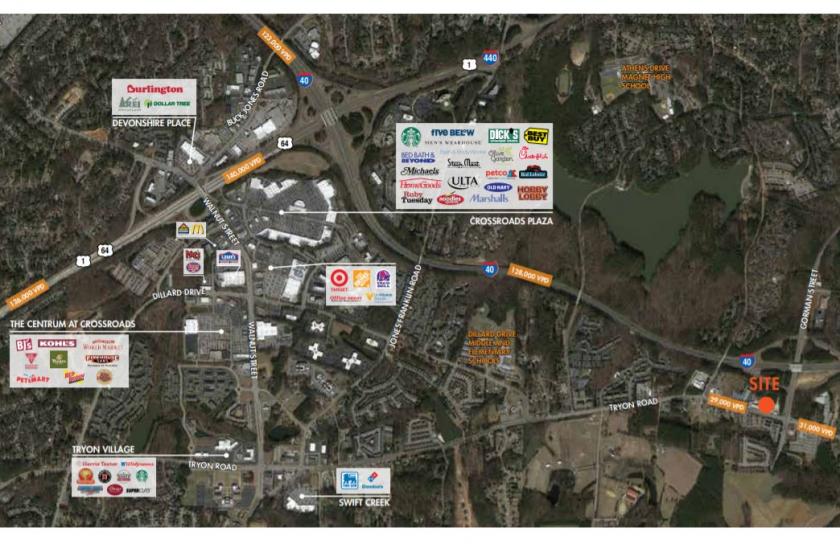
Located in Southwest Raleigh at the corner of Tryon Road and Gorman Road just off I-40 exit 295
Approximately 0.2 miles from I-40, 2.5 miles from I-440 and US Hwy 64, 3 miles to US Hwy 401, 7 miles to downtown Raleigh and 15 minutes to RDU International Airport.
Suite B - 3,765 SF of flex space
Suite C - 8,635 SF of flex space - DIVISIBLE
Suite D - 7,612 SF of warehouse space
Suite E - 17,421 SF of warehouse space
Suite F - 5,700 SF of showroom / flex space
No part of this information may be copied, reproduced, repurposed, or screen-captured for any commercial purpose without prior written authorization from MyEListing.
While we strive to provide the most accurate information, all listing information, and demographic data, is provided by third-parties. As such, MyEListing will not be responsible for the accuracy of the information. It is strongly recommended that you verify all information with the listing agent, and any relevant agencies, prior to making any decisions.
What is the building size of this commercial Flex/Office Whs property?
The size of this multi-unit property varies between 3765 - 42400 square feet
What is the population within 1 mile of 3800 Tryon Road in Raleigh?
The population within 1 mile of 3800 Tryon Road Raleigh, NC 27606 is 8,261 people.
Who do I contact for questions about 3800 Tryon Road?
You should contact the listing agent,
Nolan Mills IV, for any details regarding this commercial listing.