Retail Space
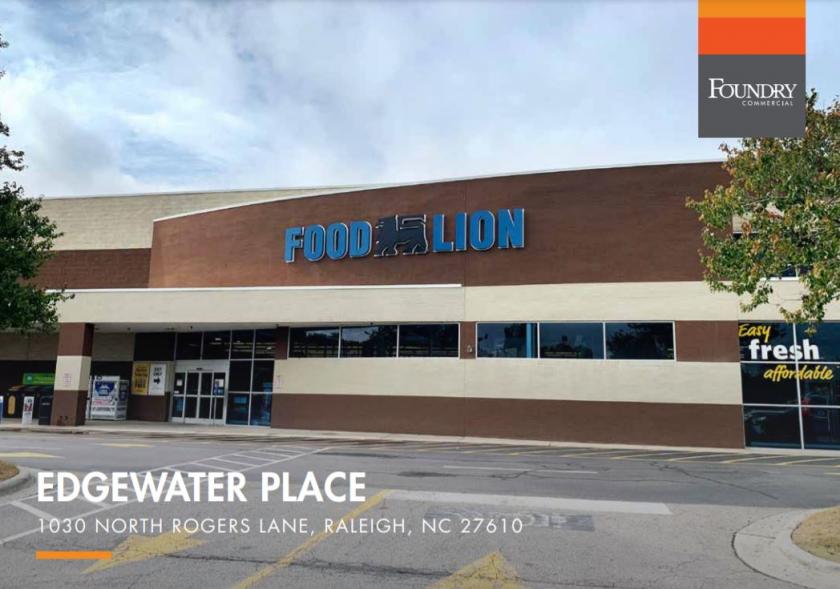
1030 North Rogers Lane Raleigh, NC 27610
1030 North Rogers Lane Raleigh, NC 27610
Details & Description
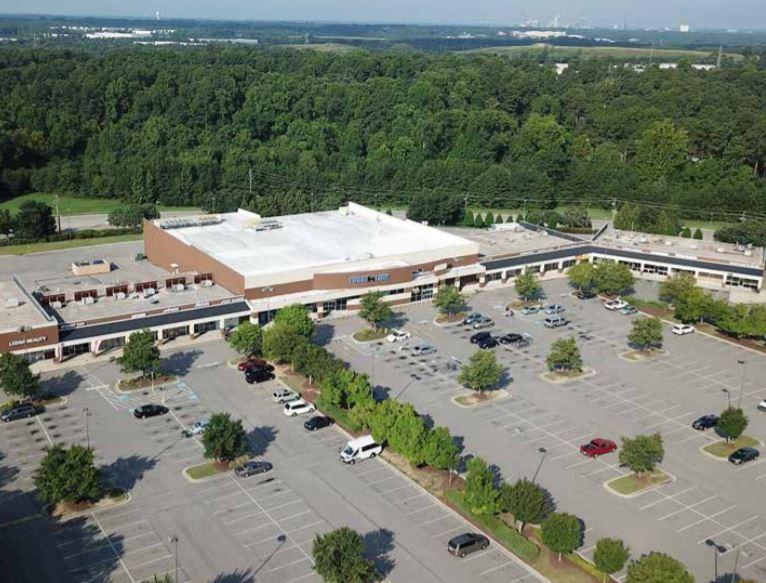
Additional Photos
Listing Agents

Nolan Mills IV
O: 919-579-2685
NOLAN.MILLS@FOUNDRYCOMMERCIAL.COM
O: 919-579-2685
NOLAN.MILLS@FOUNDRYCOMMERCIAL.COM
While we strive to provide the most accurate information, all listing information, and demographic data, is provided by third-parties. As such, MyEListing will not be responsible for the accuracy of the information. It is strongly recommended that you verify all information with the listing agent, and any relevant agencies, prior to making any decisions.


