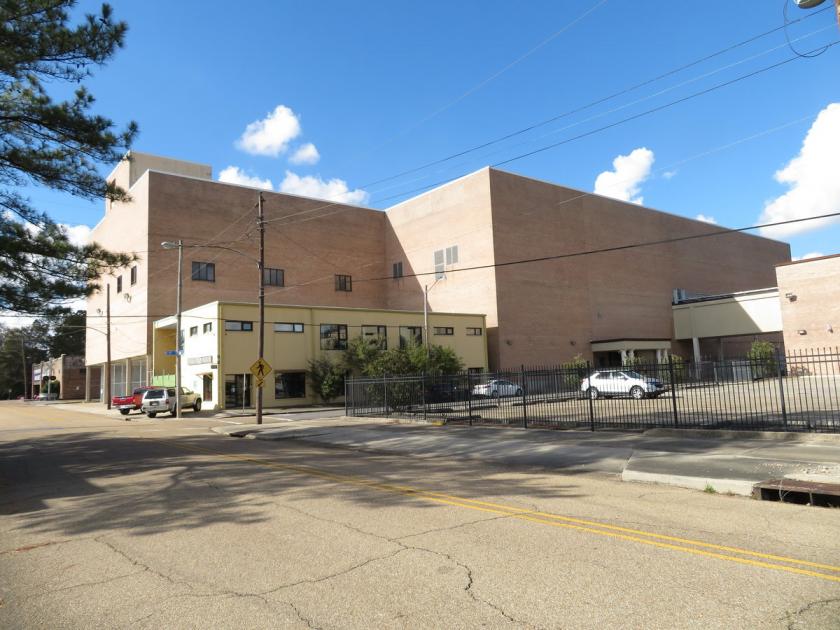
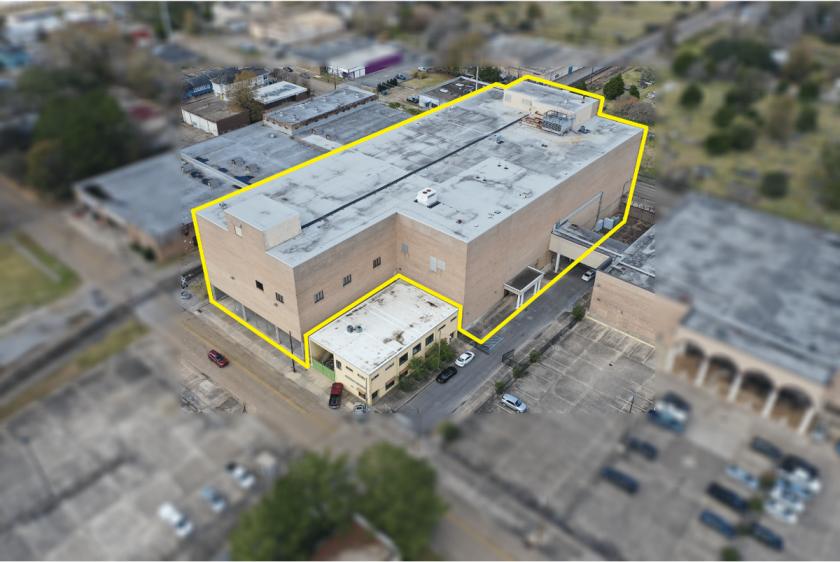
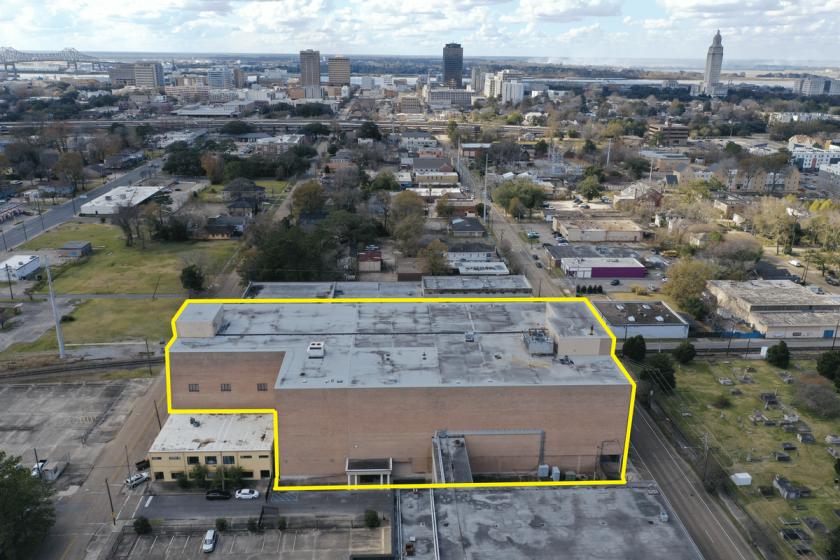
Located in the heart of Baton Rouge, this 157,957 SF, 4 story
building of concrete and steel construction, is fully climate controlled and sprinklered. It sits on 1.17 Acres of M1 zoned property, with Rail Access, includes an additional 1.66 Acres of M1 zoned property, and is conveniently located inside the Opportunity Zone.
Originally built and occupied by Goudchaux's
Department Store, followed by Netflix, and later fully occupied by FEMA during the aftermath of Hurricane Katrina (and other subsequent storms).
The Building comprises a mixture of uses, such as Warehouse (with loading docks), Office, Flex, etc.
Property Attributes:
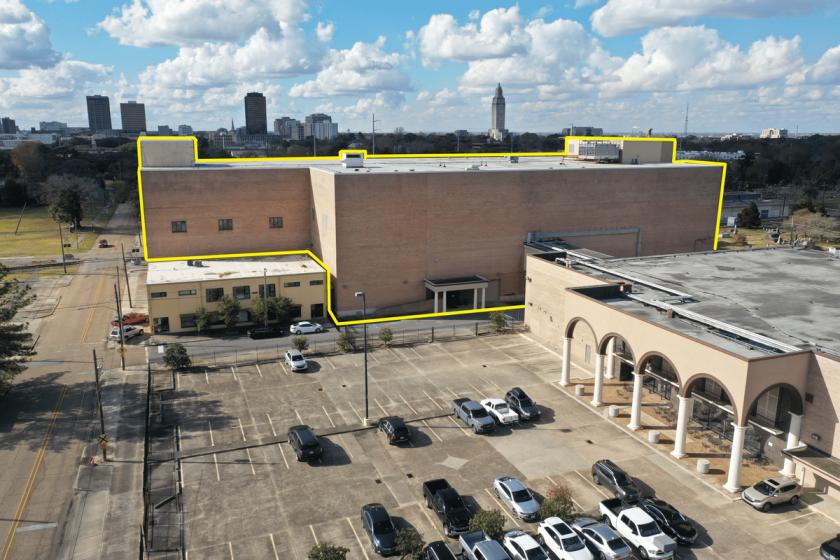
• Additional 1.66 Acres of Concrete Secured Parking for 179 Cars (Zoned M1 & C2)
• Additional Land has 100' of Florida Blvd. frontage, 400' of Laurel St. frontage
• Fully Updated Lobby/Reception with Secure Card Access
• 10 Loading Doors Total (9 Dock-High), 1 Ramp
• 15,000 SqFt covered Loading Area
Breakdown by Floor/Suite:
1-A: 6,135 SqFt Warehouse with 3 Dock HIgh Doors
1-B: 7,266 SqFt Fully Renovated Office
1-C: 6,492 SqFt Warehouse with 3 Docks & 1 Ramp
1-D: 2,952 SqFt Office
2-A: 15,280 SqFt Warehouse with access to Freight Elevator
2-B: 30,181 SqFt Warehouse with access to Freight Elevator
3-A: 8,611 SqFt Office with City Views
3-B: 36,089 SqFt Warehouse with access to Freight Elevator
4-A: 44,951 SqFt Warehouse/Storage/Office