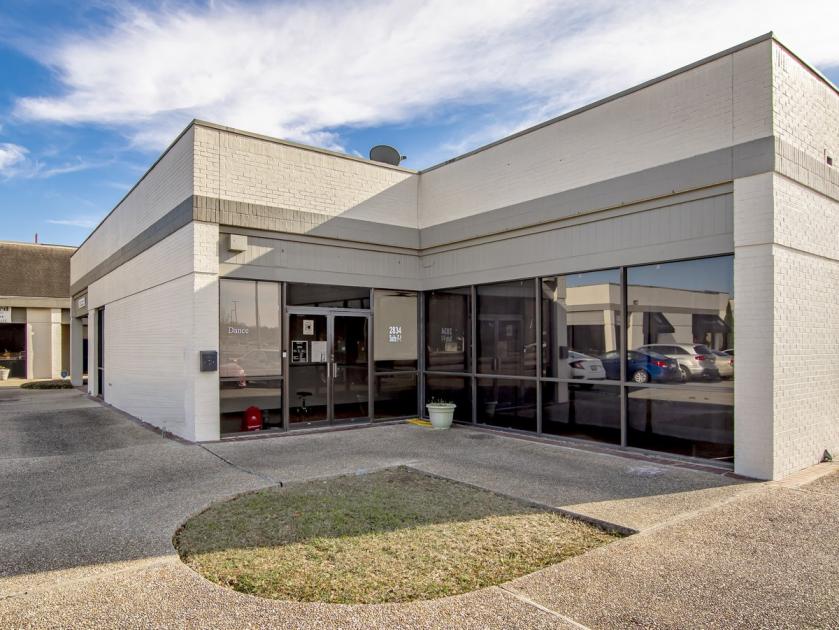
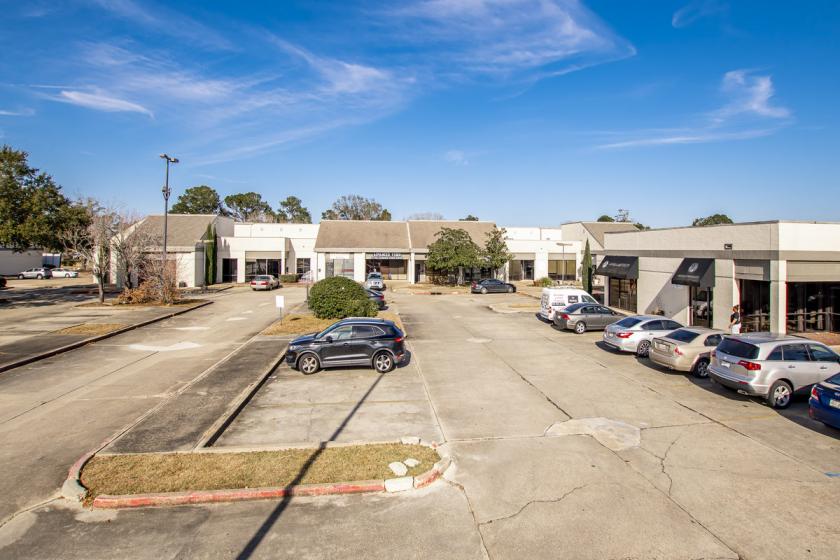
Leased Retail Suite located in Common Point Shopping Center. Space is leased on a primary term through July 31, 2022 with multiple options with escalations.
Very low maintenance facility as Condo Dues cover property insurance and exterior maintenance including roof.
Suite F-1 measures 1,461, zoned C-AB-2, located in Common Point Shopping Center.
Nice starter investment property. No lease-up uncertainty for risk adverse buyers.
Open floor plan - see floor plan attached.
Base Rent: $1,300/month
Condo Dues: $300/month paid quarterly (includes fire/casualty insurance)
2020 Property Taxes: $1,913.54
No part of this information may be copied, reproduced, repurposed, or screen-captured for any commercial purpose without prior written authorization from MyEListing.
While we strive to provide the most accurate information, all listing information, and demographic data, is provided by third-parties. As such, MyEListing will not be responsible for the accuracy of the information. It is strongly recommended that you verify all information with the listing agent, and any relevant agencies, prior to making any decisions.
What is the asking price for 2834 South Sherwood Forest Boulevard in Baton Rouge?
The asking price for 2834 South Sherwood Forest Boulevard is $109,000
What is the building size of this Retail property in Baton Rouge, LA?
The size of the building/unit at 2834 South Sherwood Forest Boulevard in Baton Rouge is 1,461 square feet
What is the population within 1 mile of 2834 South Sherwood Forest Boulevard in Baton Rouge?
The population within 1 mile of 2834 South Sherwood Forest Boulevard Baton Rouge, LA 70816 is 13,390 people.
Who do I contact for questions about 2834 South Sherwood Forest Boulevard?
You should contact the listing agent,
Matthew Shirley, for any details regarding this commercial listing.