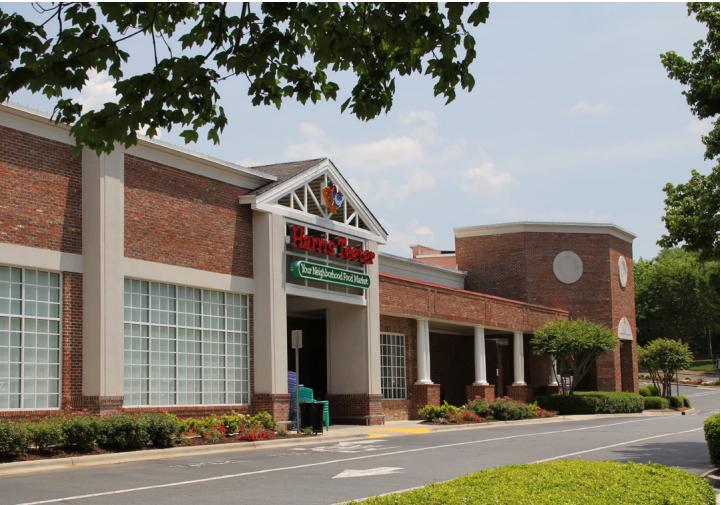
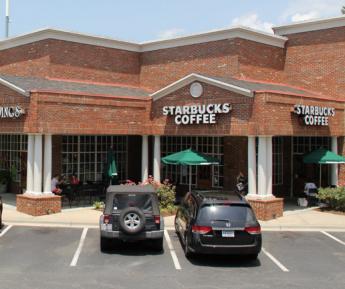
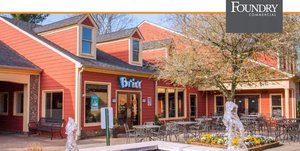
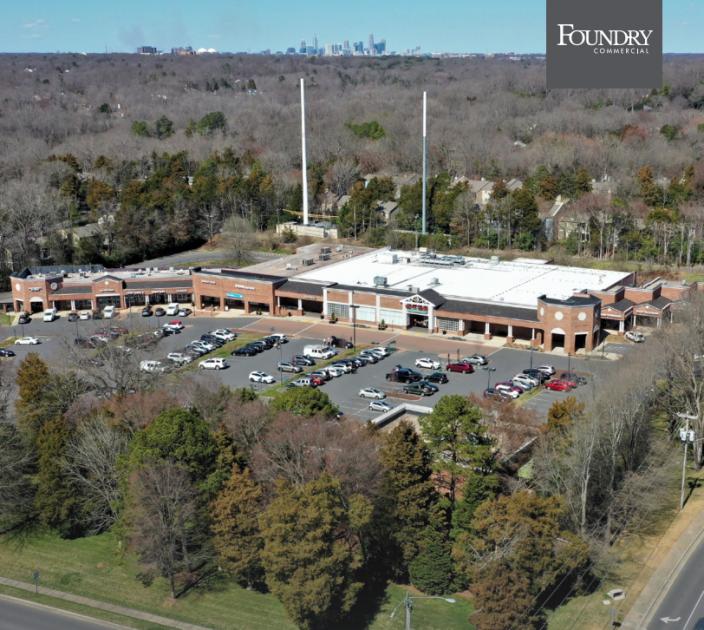
1-Mile | 3-Miles | 5-Miles | ||
---|---|---|---|---|
Total Population | 8,047 | 78,706 | 234,624 | |
Population Median Age | 40 | 40 | 38 | |
Population by Age | 0-9 Yrs | 1230 (15%) | 10166 (12%) | 31987 (13%) |
10-19 Yrs | 1127 (14%) | 9396 (11%) | 28072 (11%) | |
20-29 Yrs | 391 (4%) | 6775 (8%) | 30023 (12%) | |
30-39 Yrs | 979 (12%) | 11703 (14%) | 36459 (15%) | |
40-49 Yrs | 1176 (14%) | 10887 (13%) | 32707 (13%) | |
50-59 Yrs | 1242 (15%) | 10816 (13%) | 29704 (12%) | |
60-69 Yrs | 979 (12%) | 9242 (11%) | 23283 (9%) | |
70+ Yrs | 922 (11%) | 9721 (12%) | 22389 (9%) | |
Median HH Income | $131,354 | $105,195 | $80,347 | |
Total Household Income | < 24K | 197 (6%) | 3014 (9%) | 12843 (13%) |
25-49K | 334 (11%) | 4196 (12%) | 17033 (18%) | |
50-74K | 456 (15%) | 4901 (15%) | 15051 (15%) | |
75-99K | 195 (6%) | 3446 (10%) | 10368 (10%) | |
100-199K | 902 (29%) | 9399 (29%) | 22972 (24%) | |
200K+ | 934 (30%) | 7419 (22%) | 16023 (16%) | |
Highest Education Level | No Diploma | 118 | 1403 | 10741 |
Diploma or GED | 300 | 4253 | 19239 | |
Some College | 614 | 8247 | 25987 | |
Assoc. Degree | 267 | 3560 | 10460 | |
Bachelors Degree | 2517 | 24096 | 61336 | |
Higher Degree | 1710 | 15148 | 35015 | |
Total Housing Units | 3,280 | 34,828 | 101,355 | |
--Owner-Occupied | 2,473 | 21,941 | 55,651 | |
--Renter-Occupied | 545 | 10,433 | 38,639 | |
Owner-Occupied Values | < 100K | 42 | 467 | 1955 |
100-199K | 187 | 1883 | 8194 | |
200-299K | 105 | 3413 | 10540 | |
300-399K | 245 | 4578 | 10393 | |
400-499K | 440 | 3657 | 8123 | |
500K+ | 1453 | 7944 | 16447 | |
Total Working Age Population | 6,003 | 62,157 | 184,096 | |
In Work Force | 3,753 | 40,621 | 128,272 | |
Not In Work Force | 2,249 | 21,536 | 55,824 | |
Workforce Employed | 3,648 | 39,601 | 123,401 | |
Workforce Unemployed | 97 | 992 | 4,796 | |
Civlian Workforce | 3,745 | 40,593 | 128,198 | |
Military Workforce | 8 | 28 | 74 | |
Total Households | 3,018 | 32,374 | 94,290 | |
Family Households | 2,198 | 21,110 | 58,189 | |
Non-Family Households | 820 | 11,264 | 36,101 | |
Married Couple | 2,015 | 18,102 | 45,528 | |
Other Family | 183 | 3,009 | 12,661 | |
Married w/Child | 960 | 7,985 | 20,382 | |
Single Male w/Child | 4 | 307 | 1,765 | |
Single Female w/Child | 71 | 1,316 | 5,676 |
Population Change Last Two Decades - Plus Projection
2000 | % | 2010 | % | 2020 | % | 2030 | |
---|---|---|---|---|---|---|---|
North Carolina | 8,049,313 | +18 | 9,535,483 | +11 | 10,630,691 | +11 | 11,836,070 |
Cabarrus County | 131,063 | +36 | 178,011 | +22 | 216,608 | +20 | 259,075 |
Mecklenburg County | 695,454 | +32 | 919,628 | +23 | 1,131,342 | +19 | 1,348,822 |
Union County | 123,677 | +63 | 201,292 | +21 | 242,657 | +25 | 302,410 |
South Carolina | 4,012,012 | +15 | 4,625,364 | +9 | 5,020,400 | +9 | 5,488,460 |
Lancaster County | 61,351 | +25 | 76,652 | +4 | 79,480 | +6 | 83,940 |
York County | 164,614 | +37 | 226,073 | +12 | 252,860 | +14 | 287,970 |
Total Working Age Population:
Total Households:
Total Working Age Population:
Total Households:
Total Working Age Population:
Total Households: