Located in Perimeter Park, Raleigh-Durham’s premier business park
Superior ingress/egress off Perimeter Park Drive to Airport Boulevard providing immediate access to RDU Airport (five minute drive time), I-540, I-40, Highway 54 and the Triangle Expressway
Adjacent to market-leading residential growth and dynamic new development (McCrimmon Parkway and Evans Road extensions)
Quality retail amenity base (1.4 MSF) within a 3-mile radius
PROPERTY FEATURES
Above market parking ratio (4.8/1,000)
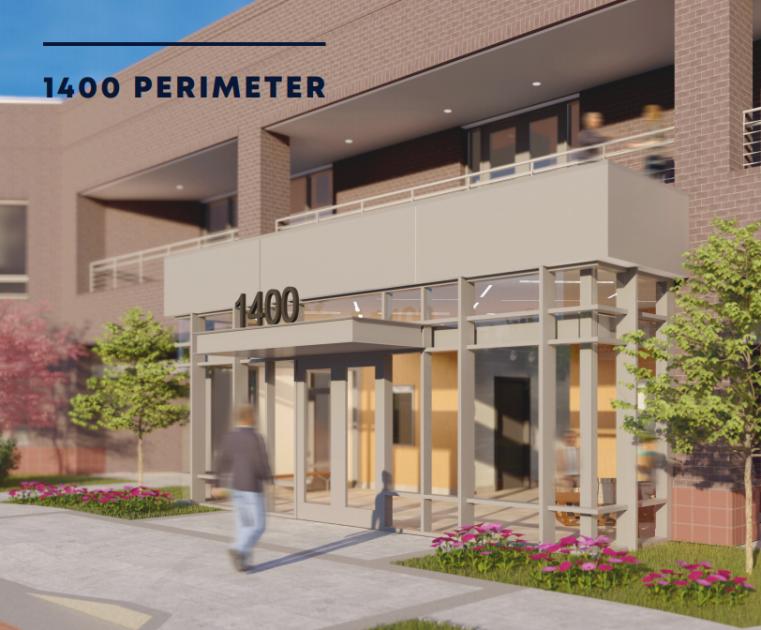
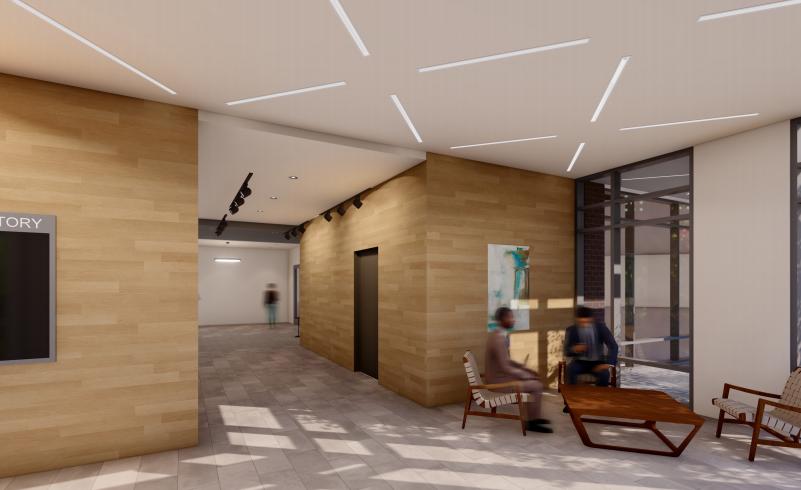
Attractive property renovations underway (expanded vestibule/lobby, common area upgrades and all new landscaping)
Large block opportunity (21,040 SF - 43,562 SF)
Building and monument signage opportunities
Emergency generator
Excellent glass line
Outdoor balcony
Customer-focused, committed ownership ensuring first class service
No part of this information may be copied, reproduced, repurposed, or screen-captured for any commercial purpose without prior written authorization from MyEListing.
While we strive to provide the most accurate information, all listing information, and demographic data, is provided by third-parties. As such, MyEListing will not be responsible for the accuracy of the information. It is strongly recommended that you verify all information with the listing agent, and any relevant agencies, prior to making any decisions.
What is the asking price for 1400 Perimeter Park Drive in Morrisville?
The asking price for 1400 Perimeter Park Drive is $26.50 a SF per Year
What is the building size of this commercial Office property?
The size of this lease property at '.1400 Perimeter Park Drive.' is 43562 square feet
What kind of Office is the propery at 1400 Perimeter Park Drive?
The property at 1400 Perimeter Park Drive Morrisville, NC 27560 is listed as a Professional Office property
What is the population within 1 mile of 1400 Perimeter Park Drive in Morrisville?
The population within 1 mile of 1400 Perimeter Park Drive Morrisville, NC 27560 is 1,428 people.
Who do I contact for questions about 1400 Perimeter Park Drive?
You should contact the listing agent,
Jordan Betz, for any details regarding this commercial listing.