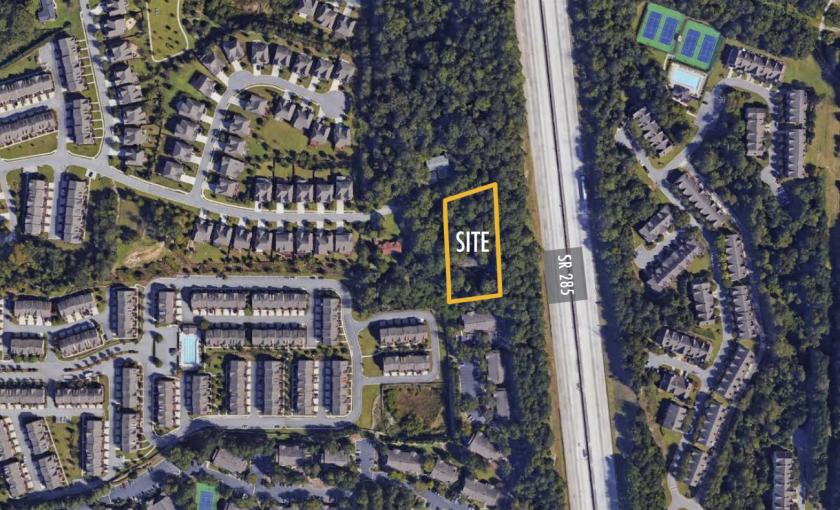
1-Mile | 3-Miles | 5-Miles | ||
---|---|---|---|---|
Total Population | 11,223 | 71,016 | 192,906 | |
Population Median Age | 38 | 37 | 36 | |
Population by Age | 0-9 Yrs | 1210 (10%) | 9119 (12%) | 26385 (13%) |
10-19 Yrs | 755 (6%) | 6140 (8%) | 18805 (9%) | |
20-29 Yrs | 1898 (16%) | 11398 (16%) | 32376 (16%) | |
30-39 Yrs | 2630 (23%) | 14235 (20%) | 36275 (18%) | |
40-49 Yrs | 1606 (14%) | 10688 (15%) | 27162 (14%) | |
50-59 Yrs | 1211 (10%) | 8262 (11%) | 21352 (11%) | |
60-69 Yrs | 1071 (9%) | 5832 (8%) | 16106 (8%) | |
70+ Yrs | 843 (7%) | 5343 (7%) | 14444 (7%) | |
Median HH Income | $88,676 | $90,799 | $76,012 | |
Total Household Income | < 24K | 300 (5%) | 2770 (8%) | 11403 (13%) |
25-49K | 986 (17%) | 4472 (14%) | 14951 (17%) | |
50-74K | 1016 (18%) | 5888 (18%) | 15097 (18%) | |
75-99K | 885 (15%) | 4196 (13%) | 10563 (12%) | |
100-199K | 1487 (26%) | 8864 (28%) | 20137 (24%) | |
200K+ | 900 (16%) | 5374 (17%) | 11607 (13%) | |
Highest Education Level | No Diploma | 280 | 1322 | 8374 |
Diploma or GED | 973 | 6073 | 21168 | |
Some College | 1701 | 8136 | 21984 | |
Assoc. Degree | 549 | 2754 | 7542 | |
Bachelors Degree | 3151 | 19401 | 46045 | |
Higher Degree | 2021 | 14159 | 31816 | |
Total Housing Units | 6,008 | 34,609 | 93,741 | |
--Owner-Occupied | 2,448 | 17,387 | 42,576 | |
--Renter-Occupied | 3,127 | 14,177 | 41,183 | |
Owner-Occupied Values | < 100K | 32 | 653 | 3794 |
100-199K | 147 | 2346 | 8780 | |
200-299K | 828 | 4177 | 9252 | |
300-399K | 541 | 3576 | 7359 | |
400-499K | 407 | 2343 | 3931 | |
500K+ | 494 | 4293 | 9460 | |
Total Working Age Population | 9,595 | 58,022 | 154,924 | |
In Work Force | 7,720 | 43,901 | 114,632 | |
Not In Work Force | 1,875 | 14,121 | 40,292 | |
Workforce Employed | 7,543 | 42,196 | 109,199 | |
Workforce Unemployed | 171 | 1,575 | 5,113 | |
Civlian Workforce | 7,714 | 43,771 | 114,312 | |
Military Workforce | 5 | 130 | 320 | |
Total Households | 5,574 | 31,564 | 83,759 | |
Family Households | 2,479 | 17,614 | 45,861 | |
Non-Family Households | 3,096 | 13,950 | 37,898 | |
Married Couple | 1,577 | 13,192 | 32,584 | |
Other Family | 902 | 4,422 | 13,277 | |
Married w/Child | 626 | 5,472 | 14,222 | |
Single Male w/Child | 58 | 317 | 1,326 | |
Single Female w/Child | 297 | 2,204 | 5,902 |
Population Change Last Two Decades - Plus Projection
2000 | % | 2010 | % | 2020 | % | 2030 | |
---|---|---|---|---|---|---|---|
Georgia | 8,186,453 | +18 | 9,687,653 | +12 | 10,833,472 | +13 | 12,292,423 |
Cobb County | 607,751 | +13 | 688,078 | +15 | 790,588 | +19 | 938,747 |
Fulton County | 816,006 | +13 | 920,581 | +19 | 1,099,181 | +18 | 1,300,861 |
Total Working Age Population:
Total Households:
Total Working Age Population:
Total Households:
Total Working Age Population:
Total Households: