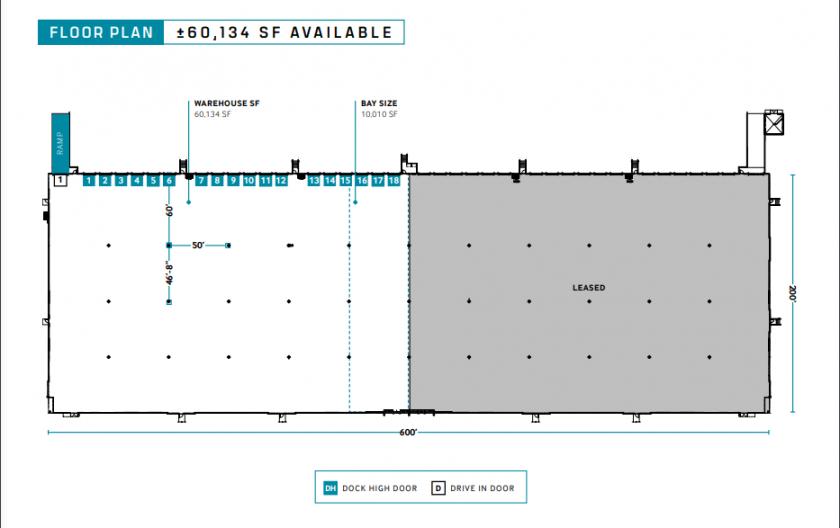
Flex-Office-Warehouse
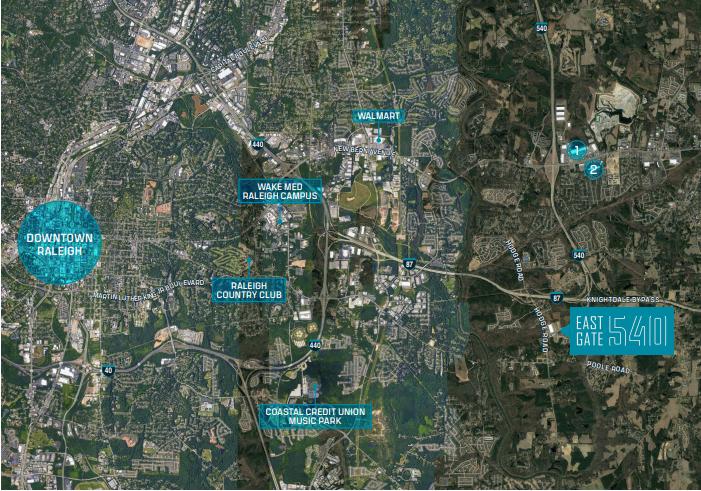
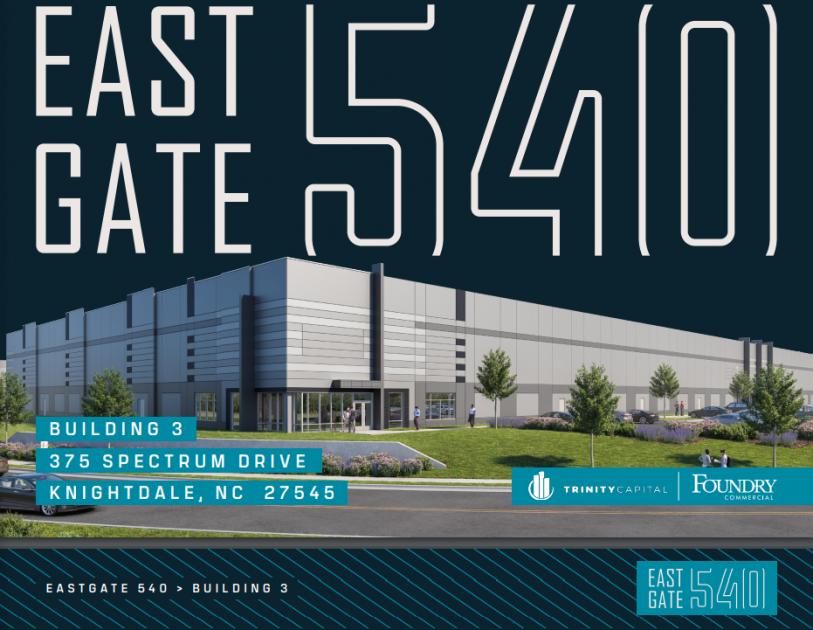
375 Spectrum Drive Knightdale, NC 27545
375 Spectrum Drive Knightdale, NC 27545
Details & Description
Listing Agents

Jackson Rives
O: 919-576-2692
M: 919-656-2816
JACKSON.RIVES@FOUNDRYCOMMERCIAL.COM
O: 919-576-2692
M: 919-656-2816
JACKSON.RIVES@FOUNDRYCOMMERCIAL.COM
While we strive to provide the most accurate information, all listing information, and demographic data, is provided by third-parties. As such, MyEListing will not be responsible for the accuracy of the information. It is strongly recommended that you verify all information with the listing agent, and any relevant agencies, prior to making any decisions.