Office Space
3780 Mansell Road Alpharetta, GA 30022
3780 Mansell Road Alpharetta, GA 30022
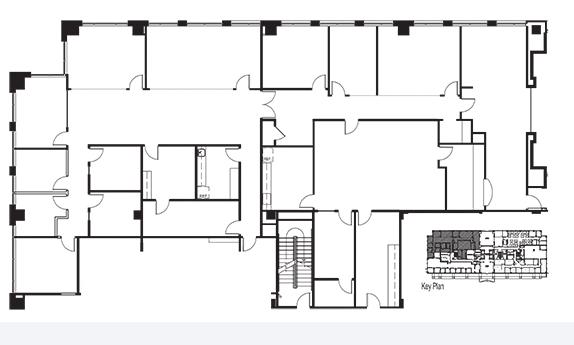
Details & Description
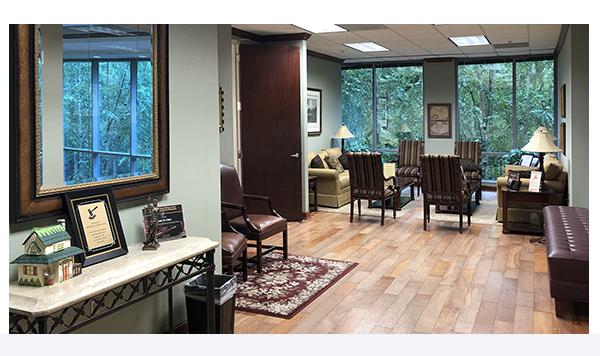
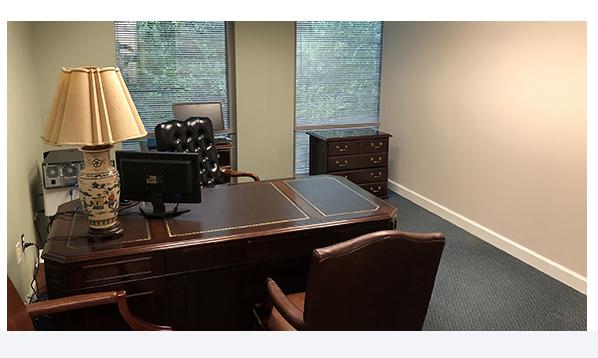
Additional Photos

Listing Agents

Danny Vander Maten
O: 404-446-1569
M: 404-989-6618
dvandermaten@cresa.com
O: 404-446-1569
M: 404-989-6618
dvandermaten@cresa.com
While we strive to provide the most accurate information, all listing information, and demographic data, is provided by third-parties. As such, MyEListing will not be responsible for the accuracy of the information. It is strongly recommended that you verify all information with the listing agent, and any relevant agencies, prior to making any decisions.


