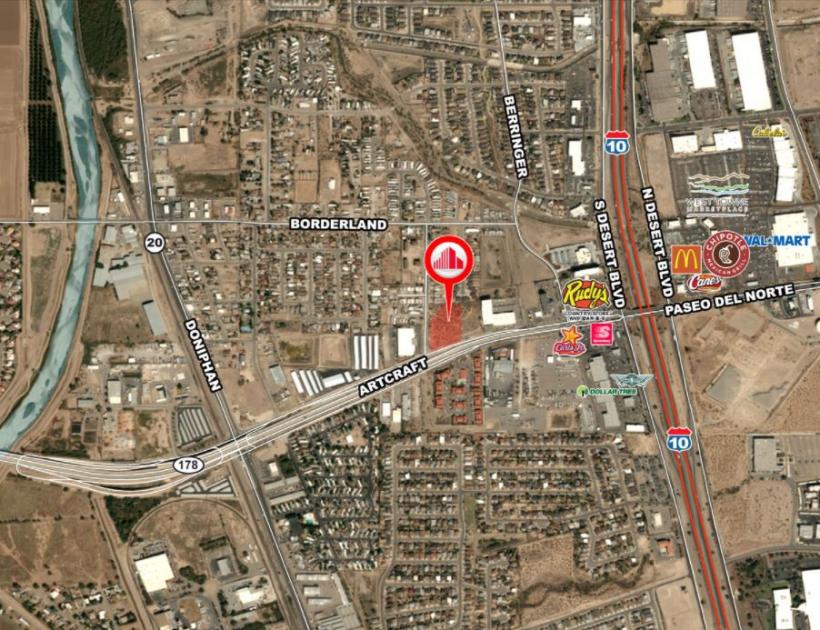
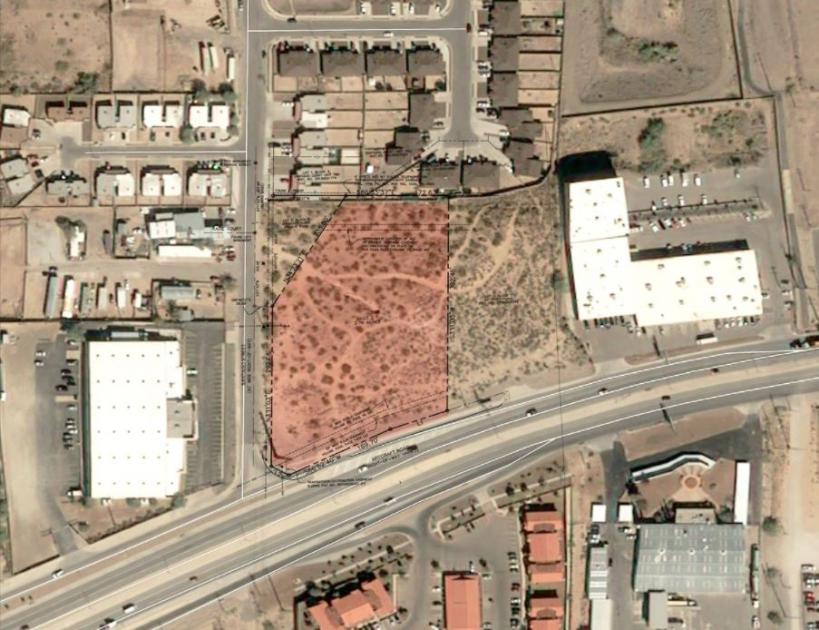
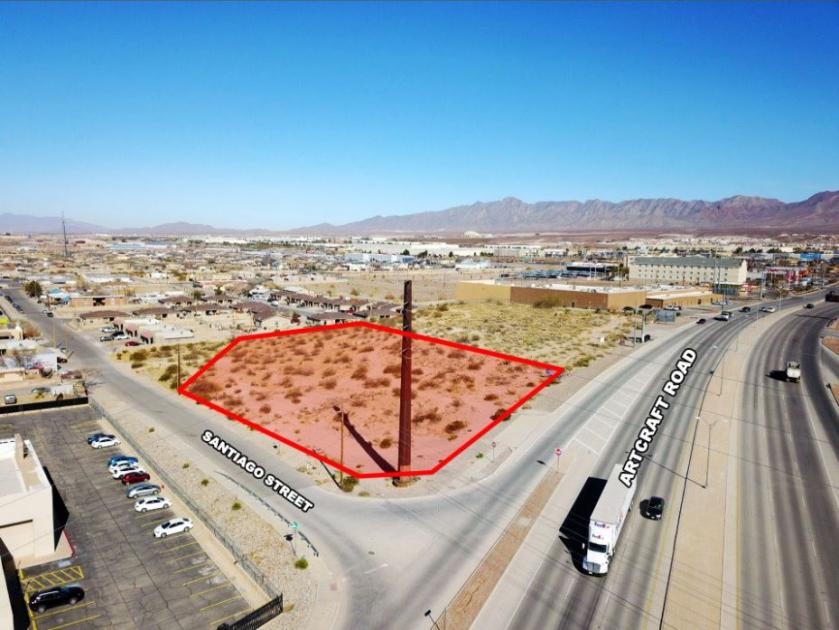
1-Mile | 3-Miles | 5-Miles | ||
---|---|---|---|---|
Total Population | 8,935 | 59,374 | 112,600 | |
Population Median Age | 32 | 34 | 36 | |
Population by Age | 0-9 Yrs | 1613 (18%) | 9792 (16%) | 17019 (15%) |
10-19 Yrs | 1381 (15%) | 8855 (14%) | 16117 (14%) | |
20-29 Yrs | 1455 (16%) | 8328 (14%) | 15844 (14%) | |
30-39 Yrs | 1113 (12%) | 8055 (13%) | 14953 (13%) | |
40-49 Yrs | 1318 (14%) | 8397 (14%) | 15523 (13%) | |
50-59 Yrs | 1067 (11%) | 7300 (12%) | 13877 (12%) | |
60-69 Yrs | 582 (6%) | 4976 (8%) | 10450 (9%) | |
70+ Yrs | 407 (4%) | 3670 (6%) | 8816 (7%) | |
Median HH Income | $58,853 | $71,475 | $70,320 | |
Total Household Income | < 24K | 603 (21%) | 3196 (16%) | 6890 (18%) |
25-49K | 551 (20%) | 3607 (19%) | 6823 (18%) | |
50-74K | 442 (16%) | 2957 (15%) | 5920 (15%) | |
75-99K | 482 (17%) | 2624 (13%) | 4917 (13%) | |
100-199K | 614 (22%) | 5304 (28%) | 10167 (27%) | |
200K+ | 53 (1%) | 1117 (5%) | 2598 (6%) | |
Highest Education Level | No Diploma | 907 | 4533 | 8255 |
Diploma or GED | 1067 | 6664 | 12493 | |
Some College | 1296 | 7835 | 14552 | |
Assoc. Degree | 309 | 2632 | 4996 | |
Bachelors Degree | 944 | 8847 | 18281 | |
Higher Degree | 731 | 6122 | 12758 | |
Total Housing Units | 2,990 | 20,631 | 41,469 | |
--Owner-Occupied | 1,756 | 13,513 | 25,977 | |
--Renter-Occupied | 989 | 5,293 | 11,338 | |
Owner-Occupied Values | < 100K | 436 | 1695 | 3148 |
100-199K | 1034 | 6759 | 11409 | |
200-299K | 244 | 3177 | 6906 | |
300-399K | 21 | 1226 | 2740 | |
400-499K | 6 | 345 | 861 | |
500K+ | 15 | 311 | 912 | |
Total Working Age Population | 6,556 | 44,438 | 86,286 | |
In Work Force | 4,458 | 29,442 | 55,821 | |
Not In Work Force | 2,099 | 14,996 | 30,465 | |
Workforce Employed | 4,176 | 27,800 | 52,765 | |
Workforce Unemployed | 216 | 1,284 | 2,508 | |
Civlian Workforce | 4,392 | 29,084 | 55,273 | |
Military Workforce | 66 | 358 | 549 | |
Total Households | 2,745 | 18,805 | 37,314 | |
Family Households | 2,029 | 14,271 | 27,251 | |
Non-Family Households | 716 | 4,535 | 10,064 | |
Married Couple | 1,517 | 10,578 | 20,631 | |
Other Family | 512 | 3,693 | 6,620 | |
Married w/Child | 742 | 5,025 | 9,410 | |
Single Male w/Child | 34 | 332 | 512 | |
Single Female w/Child | 207 | 1,380 | 2,613 |
Population Change Last Two Decades - Plus Projection
2000 | % | 2010 | % | 2020 | % | 2030 | |
---|---|---|---|---|---|---|---|
New Mexico | 1,819,046 | +13 | 2,059,179 | +6 | 2,187,183 | +6 | 2,308,475 |
Doña Ana County | 174,682 | +20 | 209,233 | +11 | 232,946 | +9 | 255,070 |
Texas | 20,851,820 | +21 | 25,145,561 | +18 | 29,677,668 | +18 | 34,894,452 |
El Paso County | 679,622 | +18 | 800,647 | +9 | 876,120 | +7 | 936,697 |
Total Working Age Population:
Total Households:
Total Working Age Population:
Total Households:
Total Working Age Population:
Total Households: