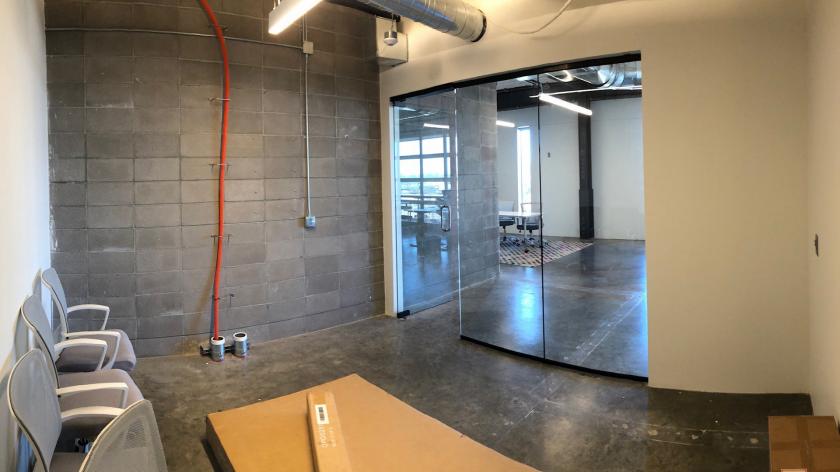
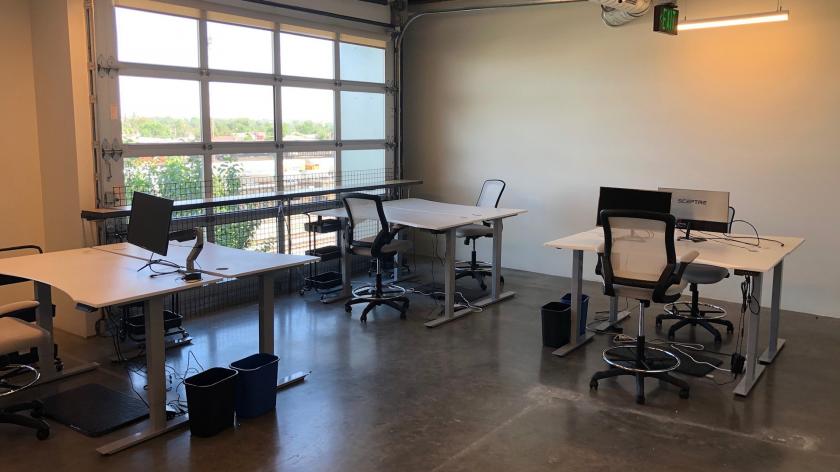
1-Mile | 3-Miles | 5-Miles | ||
---|---|---|---|---|
Total Population | 13,552 | 163,311 | 415,993 | |
Population Median Age | 33 | 36 | 37 | |
Population by Age | 0-9 Yrs | 1126 (8%) | 13275 (8%) | 43050 (10%) |
10-19 Yrs | 1454 (10%) | 12706 (7%) | 37110 (8%) | |
20-29 Yrs | 3909 (28%) | 38834 (23%) | 79374 (19%) | |
30-39 Yrs | 3262 (24%) | 40346 (24%) | 89790 (21%) | |
40-49 Yrs | 1278 (9%) | 20096 (12%) | 54678 (13%) | |
50-59 Yrs | 1342 (9%) | 15644 (9%) | 43954 (10%) | |
60-69 Yrs | 768 (5%) | 13029 (7%) | 37329 (8%) | |
70+ Yrs | 414 (3%) | 9380 (5%) | 30707 (7%) | |
Median HH Income | $69,510 | $68,260 | $68,232 | |
Total Household Income | < 24K | 1129 (19%) | 16738 (20%) | 35394 (18%) |
25-49K | 884 (15%) | 13727 (16%) | 34453 (18%) | |
50-74K | 1063 (18%) | 13046 (16%) | 31333 (16%) | |
75-99K | 706 (12%) | 9842 (12%) | 22540 (12%) | |
100-199K | 1498 (26%) | 19455 (24%) | 43425 (23%) | |
200K+ | 443 (7%) | 8037 (9%) | 19755 (10%) | |
Highest Education Level | No Diploma | 1670 | 12989 | 38111 |
Diploma or GED | 1531 | 17035 | 51363 | |
Some College | 1585 | 18645 | 49199 | |
Assoc. Degree | 433 | 6272 | 15313 | |
Bachelors Degree | 3198 | 45361 | 95005 | |
Higher Degree | 1322 | 26287 | 61497 | |
Total Housing Units | 6,184 | 88,132 | 200,957 | |
--Owner-Occupied | 1,700 | 30,714 | 87,902 | |
--Renter-Occupied | 4,023 | 50,131 | 98,998 | |
Owner-Occupied Values | < 100K | 105 | 848 | 2689 |
100-199K | 141 | 2137 | 7497 | |
200-299K | 388 | 4559 | 15193 | |
300-399K | 358 | 5806 | 17002 | |
400-499K | 313 | 5983 | 14024 | |
500K+ | 395 | 11381 | 31496 | |
Total Working Age Population | 11,694 | 143,285 | 351,221 | |
In Work Force | 8,932 | 109,701 | 258,822 | |
Not In Work Force | 2,761 | 33,584 | 92,400 | |
Workforce Employed | 8,566 | 105,587 | 248,455 | |
Workforce Unemployed | 367 | 4,090 | 10,234 | |
Civlian Workforce | 8,932 | 109,678 | 258,690 | |
Military Workforce | 0 | 23 | 132 | |
Total Households | 5,723 | 80,845 | 186,899 | |
Family Households | 2,156 | 28,300 | 81,990 | |
Non-Family Households | 3,567 | 52,545 | 104,909 | |
Married Couple | 1,168 | 19,156 | 58,130 | |
Other Family | 989 | 9,144 | 23,860 | |
Married w/Child | 300 | 5,980 | 22,684 | |
Single Male w/Child | 142 | 1,281 | 3,222 | |
Single Female w/Child | 377 | 3,202 | 8,107 |
Population Change Last Two Decades - Plus Projection
2000 | % | 2010 | % | 2020 | % | 2030 | |
---|---|---|---|---|---|---|---|
Colorado | 4,301,261 | +17 | 5,029,196 | +16 | 5,838,181 | +15 | 6,733,658 |
Adams County | 363,857 | +21 | 441,603 | +20 | 530,680 | +21 | 642,318 |
Arapahoe County | 487,967 | +17 | 572,003 | +16 | 662,304 | +13 | 750,773 |
Denver County | 554,636 | +8 | 600,158 | +23 | 738,611 | +12 | 827,681 |
Jefferson County | 527,056 | +1 | 534,543 | +10 | 587,118 | +7 | 626,742 |
Total Working Age Population:
Total Households:
Total Working Age Population:
Total Households:
Total Working Age Population:
Total Households: