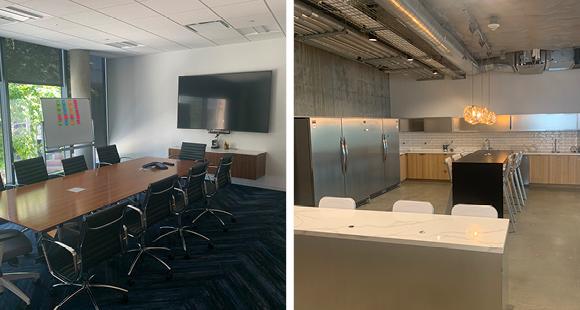
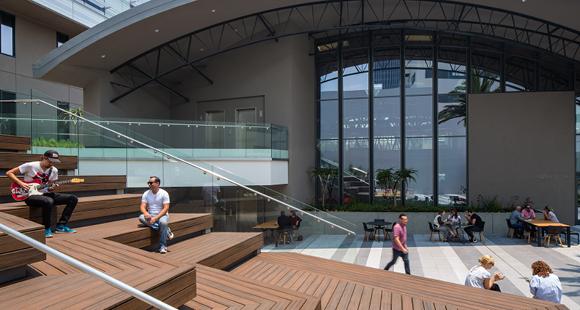
1-Mile | 3-Miles | 5-Miles | ||
---|---|---|---|---|
Total Population | 58,035 | 368,445 | 973,386 | |
Population Median Age | 39 | 39 | 38 | |
Population by Age | 0-9 Yrs | 3530 (6%) | 30259 (8%) | 94136 (9%) |
10-19 Yrs | 3630 (6%) | 24990 (6%) | 83267 (8%) | |
20-29 Yrs | 13876 (23%) | 71816 (19%) | 178064 (18%) | |
30-39 Yrs | 11766 (20%) | 77226 (20%) | 188782 (19%) | |
40-49 Yrs | 8862 (15%) | 55542 (15%) | 139805 (14%) | |
50-59 Yrs | 7057 (12%) | 44408 (12%) | 117858 (12%) | |
60-69 Yrs | 4791 (8%) | 33231 (9%) | 88782 (9%) | |
70+ Yrs | 4524 (7%) | 30973 (8%) | 82693 (8%) | |
Median HH Income | $46,875 | $58,745 | $58,471 | |
Total Household Income | < 24K | 8792 (30%) | 39572 (23%) | 95073 (23%) |
25-49K | 6020 (21%) | 35899 (21%) | 86064 (21%) | |
50-74K | 5263 (18%) | 27803 (16%) | 65712 (16%) | |
75-99K | 2970 (10%) | 19213 (11%) | 45156 (11%) | |
100-199K | 4044 (14%) | 31891 (18%) | 77534 (18%) | |
200K+ | 1437 (5%) | 16541 (9%) | 39777 (9%) | |
Highest Education Level | No Diploma | 7412 | 40293 | 139919 |
Diploma or GED | 7826 | 46958 | 122366 | |
Some College | 8174 | 45906 | 116339 | |
Assoc. Degree | 2604 | 16018 | 43486 | |
Bachelors Degree | 14534 | 97603 | 212453 | |
Higher Degree | 5140 | 42440 | 96044 | |
Total Housing Units | 33,710 | 193,780 | 454,537 | |
--Owner-Occupied | 2,528 | 30,001 | 85,400 | |
--Renter-Occupied | 25,999 | 140,918 | 323,916 | |
Owner-Occupied Values | < 100K | 69 | 422 | 1432 |
100-199K | 8 | 316 | 779 | |
200-299K | 31 | 497 | 1556 | |
300-399K | 81 | 1084 | 3295 | |
400-499K | 103 | 1354 | 5091 | |
500K+ | 2235 | 26327 | 73247 | |
Total Working Age Population | 52,727 | 323,281 | 828,784 | |
In Work Force | 38,586 | 236,819 | 589,740 | |
Not In Work Force | 14,142 | 86,462 | 239,044 | |
Workforce Employed | 35,801 | 221,959 | 552,692 | |
Workforce Unemployed | 2,767 | 14,742 | 36,615 | |
Civlian Workforce | 38,568 | 236,701 | 589,307 | |
Military Workforce | 18 | 118 | 434 | |
Total Households | 28,526 | 170,919 | 409,316 | |
Family Households | 9,332 | 69,097 | 192,707 | |
Non-Family Households | 19,194 | 101,822 | 216,609 | |
Married Couple | 5,866 | 47,790 | 125,146 | |
Other Family | 3,466 | 21,307 | 67,561 | |
Married w/Child | 1,787 | 17,216 | 48,302 | |
Single Male w/Child | 357 | 1,968 | 8,242 | |
Single Female w/Child | 788 | 5,761 | 18,934 |
Population Change Last Two Decades - Plus Projection
2000 | % | 2010 | % | 2020 | % | 2030 | |
---|---|---|---|---|---|---|---|
California | 33,871,648 | +10 | 37,253,956 | +9 | 40,467,295 | +8 | 43,631,295 |
Los Angeles County | 9,519,338 | +3 | 9,818,605 | +6 | 10,369,367 | +4 | 10,759,850 |
Total Working Age Population:
Total Households:
Total Working Age Population:
Total Households:
Total Working Age Population:
Total Households: