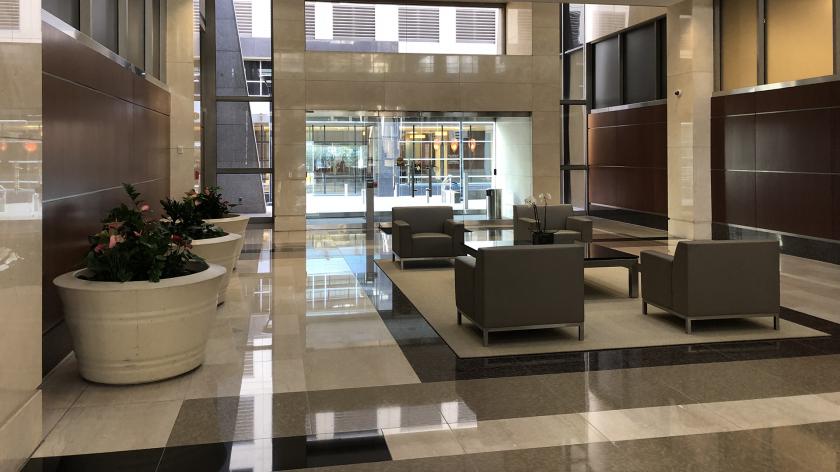
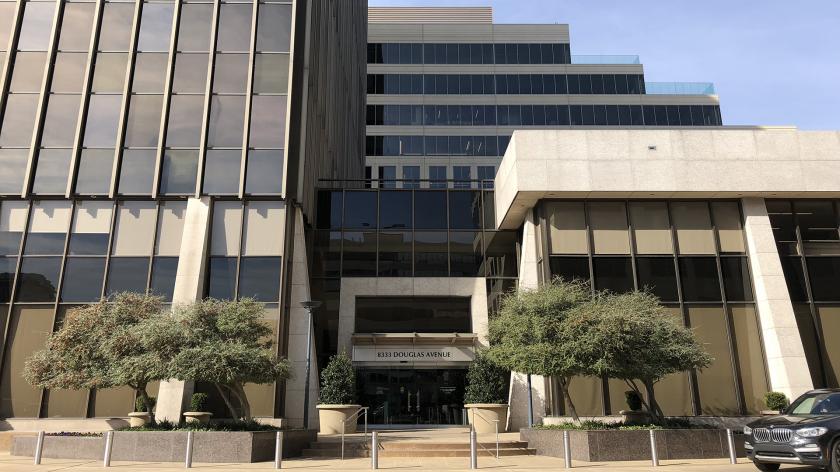
1-Mile | 3-Miles | 5-Miles | ||
---|---|---|---|---|
Total Population | 11,252 | 120,820 | 385,145 | |
Population Median Age | 41 | 39 | 37 | |
Population by Age | 0-9 Yrs | 1585 (14%) | 12738 (10%) | 43266 (11%) |
10-19 Yrs | 1632 (14%) | 13587 (11%) | 38580 (10%) | |
20-29 Yrs | 442 (3%) | 19581 (16%) | 74865 (19%) | |
30-39 Yrs | 1178 (10%) | 16580 (13%) | 66565 (17%) | |
40-49 Yrs | 1748 (15%) | 15815 (13%) | 49449 (12%) | |
50-59 Yrs | 1837 (16%) | 16534 (13%) | 45810 (11%) | |
60-69 Yrs | 1484 (13%) | 13430 (11%) | 35311 (9%) | |
70+ Yrs | 1346 (11%) | 12554 (10%) | 31298 (8%) | |
Median HH Income | $168,782 | $89,531 | $74,478 | |
Total Household Income | < 24K | 279 (6%) | 7084 (13%) | 25809 (14%) |
25-49K | 506 (11%) | 9008 (16%) | 32875 (19%) | |
50-74K | 441 (9%) | 7930 (14%) | 28158 (16%) | |
75-99K | 302 (6%) | 5473 (10%) | 18375 (10%) | |
100-199K | 902 (20%) | 10309 (18%) | 36039 (20%) | |
200K+ | 2052 (45%) | 14602 (26%) | 31376 (18%) | |
Highest Education Level | No Diploma | 114 | 5418 | 37359 |
Diploma or GED | 240 | 7435 | 32734 | |
Some College | 784 | 10840 | 38516 | |
Assoc. Degree | 182 | 2582 | 10462 | |
Bachelors Degree | 3529 | 34048 | 91805 | |
Higher Degree | 2983 | 25442 | 63129 | |
Total Housing Units | 5,048 | 61,966 | 195,934 | |
--Owner-Occupied | 3,713 | 28,627 | 71,726 | |
--Renter-Occupied | 770 | 25,779 | 100,905 | |
Owner-Occupied Values | < 100K | 51 | 1054 | 3767 |
100-199K | 199 | 2793 | 9368 | |
200-299K | 269 | 2368 | 8140 | |
300-399K | 197 | 1685 | 8690 | |
400-499K | 84 | 1645 | 8088 | |
500K+ | 2913 | 19080 | 33672 | |
Total Working Age Population | 8,634 | 100,037 | 317,947 | |
In Work Force | 5,164 | 68,050 | 230,855 | |
Not In Work Force | 3,471 | 31,987 | 87,091 | |
Workforce Employed | 5,015 | 65,925 | 223,125 | |
Workforce Unemployed | 148 | 2,089 | 7,622 | |
Civlian Workforce | 5,164 | 68,014 | 230,747 | |
Military Workforce | 0 | 36 | 108 | |
Total Households | 4,483 | 54,406 | 172,632 | |
Family Households | 3,223 | 28,943 | 85,291 | |
Non-Family Households | 1,260 | 25,463 | 87,341 | |
Married Couple | 2,937 | 24,562 | 66,043 | |
Other Family | 285 | 4,381 | 19,248 | |
Married w/Child | 1,516 | 10,499 | 28,331 | |
Single Male w/Child | 58 | 649 | 2,360 | |
Single Female w/Child | 117 | 1,567 | 7,054 |
Population Change Last Two Decades - Plus Projection
2000 | % | 2010 | % | 2020 | % | 2030 | |
---|---|---|---|---|---|---|---|
Texas | 20,851,820 | +21 | 25,145,561 | +18 | 29,677,668 | +18 | 34,894,452 |
Dallas County | 2,218,899 | +7 | 2,368,139 | +15 | 2,734,111 | +14 | 3,106,298 |
Total Working Age Population:
Total Households:
Total Working Age Population:
Total Households:
Total Working Age Population:
Total Households: