Office Space
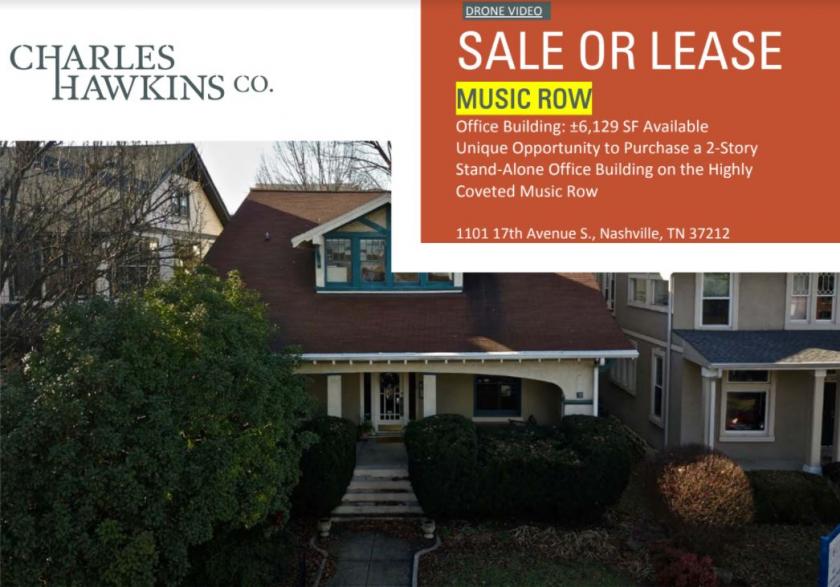
1101 17th Avenue South Nashville, TN 37212
1101 17th Avenue South Nashville, TN 37212
Details & Description
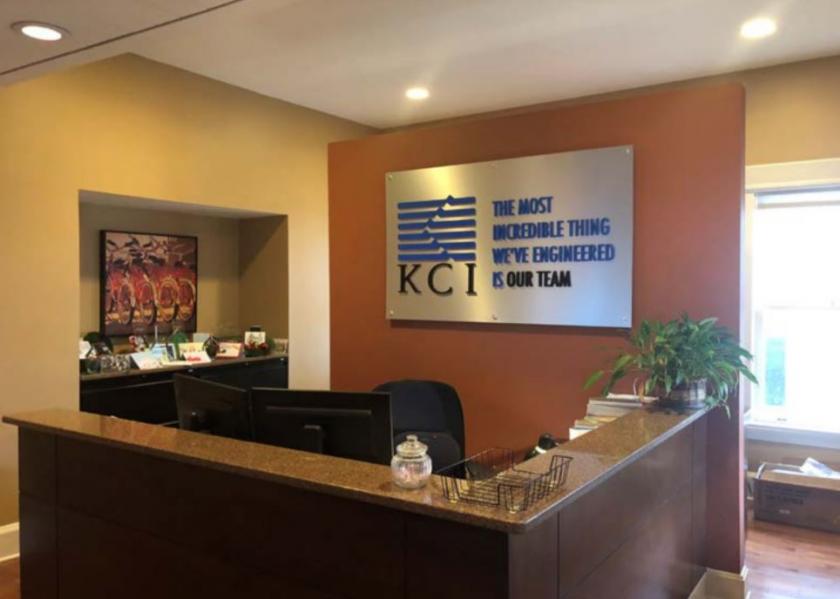
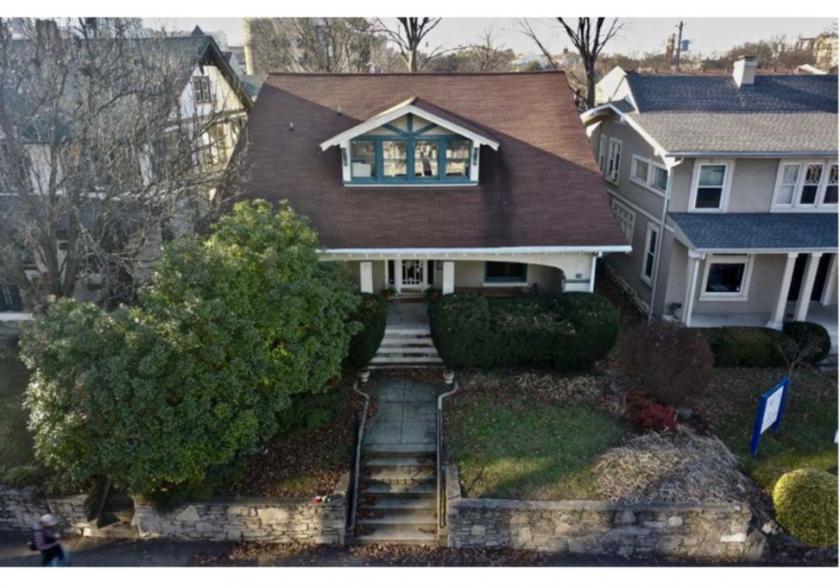
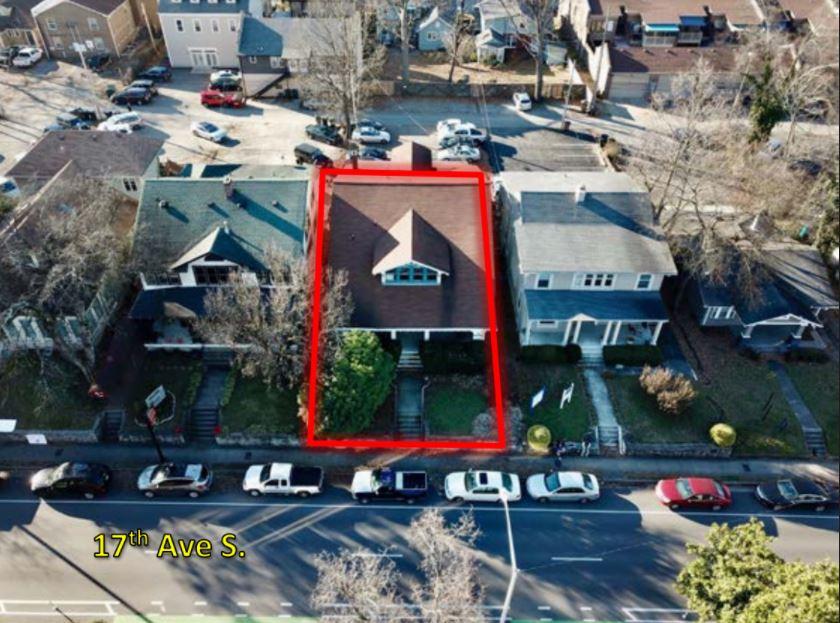
Additional Photos
Listing Agents

Stephen Prather
O: 615-345-7254
sprather@charleshawkinsco.com
O: 615-345-7254
sprather@charleshawkinsco.com

Charles Hawkins Commercial
Charles Hawkins Commercial
O: 615-256-3189
KGarland@charleshawkinsco.com
Charles Hawkins Commercial
O: 615-256-3189
KGarland@charleshawkinsco.com
While we strive to provide the most accurate information, all listing information, and demographic data, is provided by third-parties. As such, MyEListing will not be responsible for the accuracy of the information. It is strongly recommended that you verify all information with the listing agent, and any relevant agencies, prior to making any decisions.


