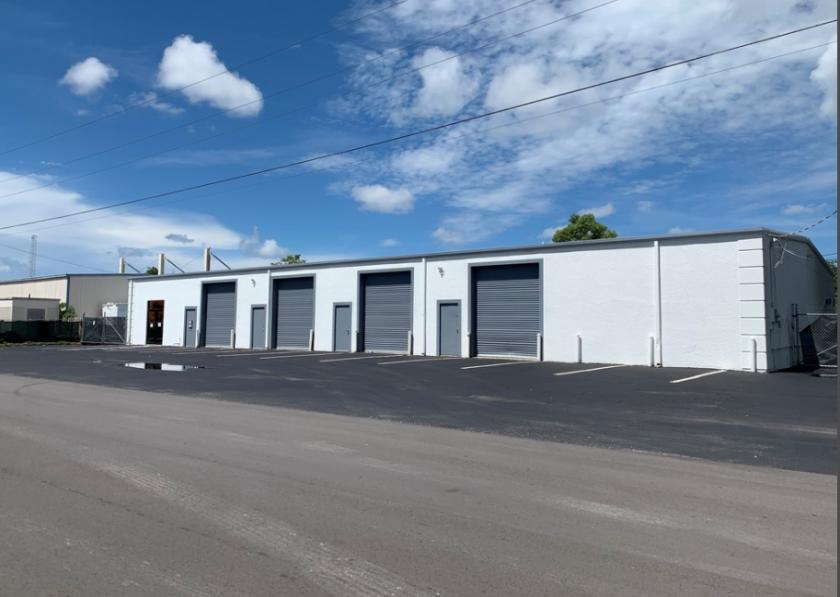
Industrial Properties
6203 Janes Lane Naples, FL 34109
6203 Janes Lane Naples, FL 34109
Details & Description
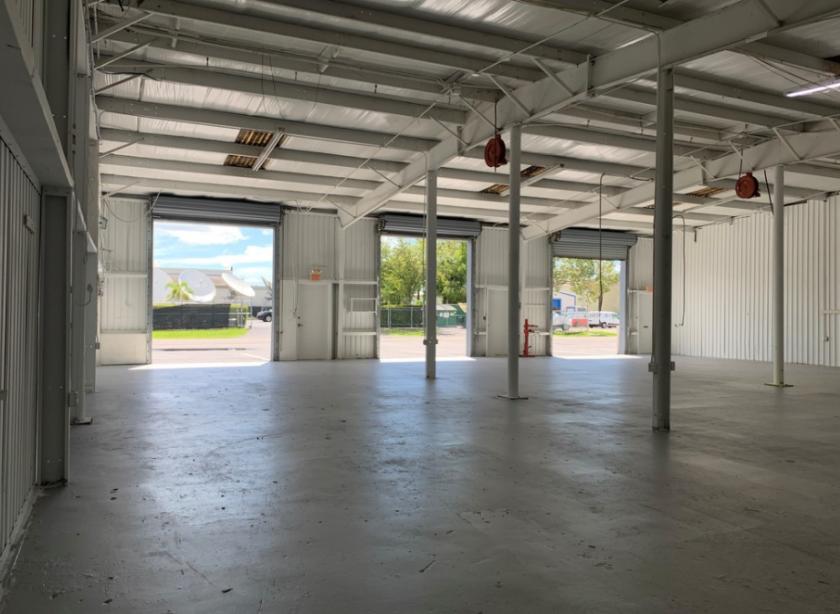
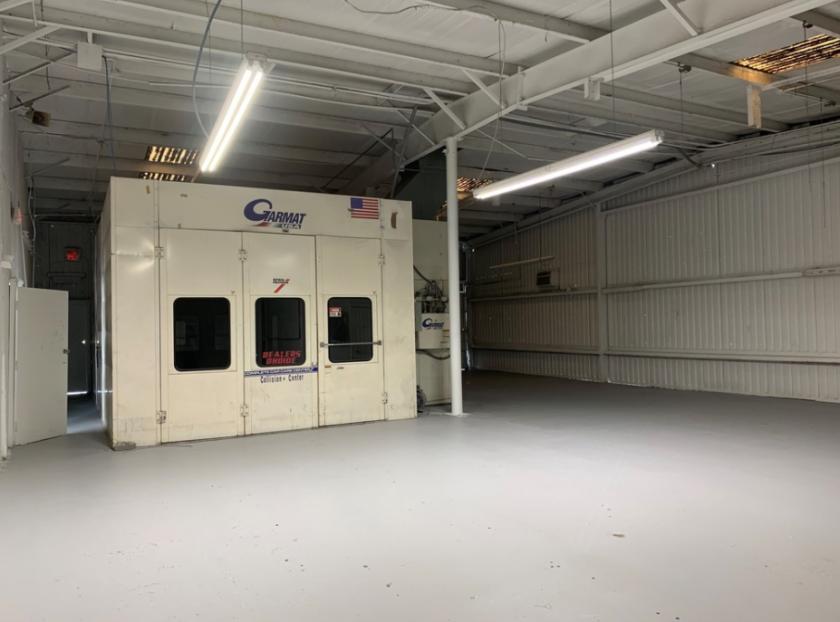
Additional Photos

Listing Agents

Eric Edwards
O: 239-494-5448
M: 239-877-3958
eedwards@lqwest.com
O: 239-494-5448
M: 239-877-3958
eedwards@lqwest.com

LandQwest CRE
LandQwest CRE Services
O: 239-275-4922
marketing@lqwest.com
LandQwest CRE Services
O: 239-275-4922
marketing@lqwest.com
While we strive to provide the most accurate information, all listing information, and demographic data, is provided by third-parties. As such, MyEListing will not be responsible for the accuracy of the information. It is strongly recommended that you verify all information with the listing agent, and any relevant agencies, prior to making any decisions.


