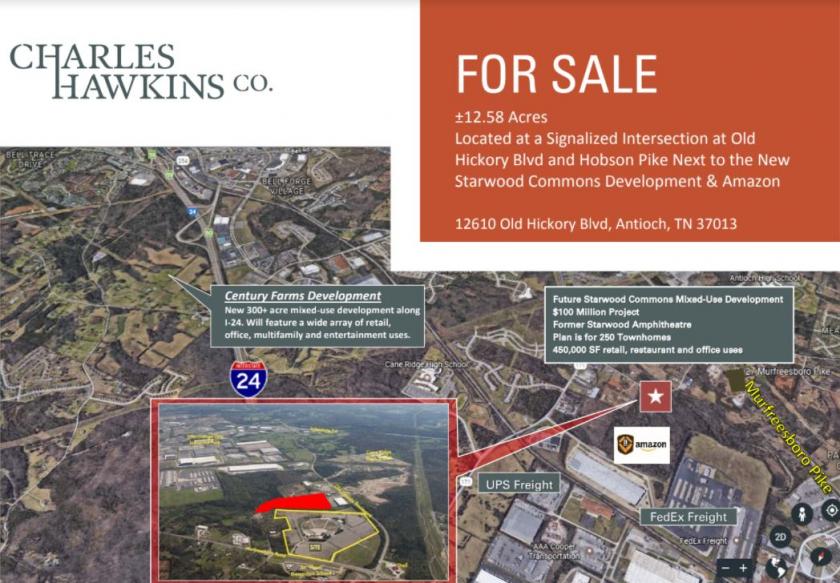
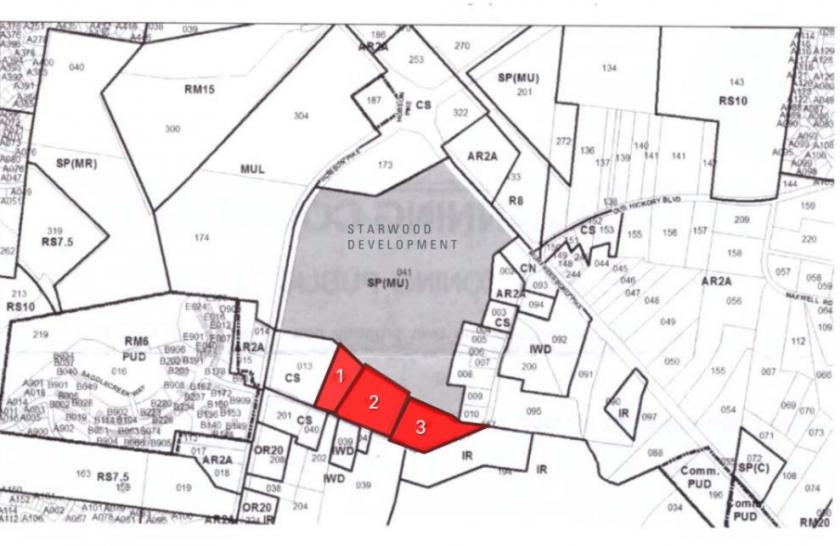
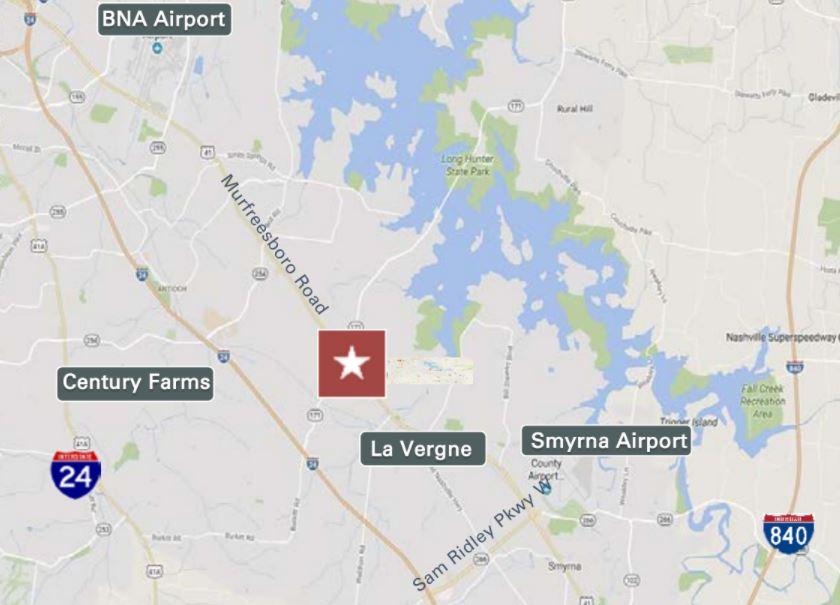
1-Mile | 3-Miles | 5-Miles | ||
---|---|---|---|---|
Total Population | 3,380 | 55,117 | 149,597 | |
Population Median Age | 32 | 33 | 33 | |
Population by Age | 0-9 Yrs | 526 (15%) | 8865 (16%) | 23054 (15%) |
10-19 Yrs | 546 (16%) | 7447 (13%) | 19936 (13%) | |
20-29 Yrs | 518 (15%) | 9759 (17%) | 24590 (16%) | |
30-39 Yrs | 668 (19%) | 9615 (17%) | 26514 (17%) | |
40-49 Yrs | 438 (12%) | 7361 (13%) | 20036 (13%) | |
50-59 Yrs | 397 (11%) | 5987 (10%) | 17213 (11%) | |
60-69 Yrs | 207 (6%) | 3943 (7%) | 11896 (7%) | |
70+ Yrs | 80 (2%) | 2140 (3%) | 6358 (4%) | |
Median HH Income | $57,793 | $60,992 | $61,864 | |
Total Household Income | < 24K | 204 (16%) | 2966 (14%) | 7082 (12%) |
25-49K | 330 (26%) | 4711 (23%) | 13632 (25%) | |
50-74K | 301 (23%) | 4742 (23%) | 13013 (23%) | |
75-99K | 222 (17%) | 3533 (17%) | 8969 (16%) | |
100-199K | 195 (15%) | 3381 (17%) | 10152 (18%) | |
200K+ | 9 (0%) | 444 (2%) | 1638 (3%) | |
Highest Education Level | No Diploma | 196 | 3613 | 10516 |
Diploma or GED | 470 | 9084 | 25629 | |
Some College | 399 | 7584 | 20876 | |
Assoc. Degree | 255 | 3368 | 8949 | |
Bachelors Degree | 532 | 7584 | 21225 | |
Higher Degree | 295 | 3285 | 9054 | |
Total Housing Units | 1,369 | 21,038 | 58,448 | |
--Owner-Occupied | 790 | 11,463 | 31,105 | |
--Renter-Occupied | 471 | 8,314 | 23,380 | |
Owner-Occupied Values | < 100K | 58 | 779 | 2387 |
100-199K | 408 | 6082 | 16162 | |
200-299K | 303 | 3732 | 9012 | |
300-399K | 7 | 596 | 2575 | |
400-499K | 0 | 72 | 432 | |
500K+ | 13 | 201 | 537 | |
Total Working Age Population | 2,494 | 41,486 | 113,581 | |
In Work Force | 2,072 | 31,971 | 86,827 | |
Not In Work Force | 422 | 9,515 | 26,754 | |
Workforce Employed | 2,002 | 30,869 | 83,584 | |
Workforce Unemployed | 70 | 1,084 | 3,131 | |
Civlian Workforce | 2,072 | 31,953 | 86,715 | |
Military Workforce | 0 | 18 | 112 | |
Total Households | 1,261 | 19,777 | 54,485 | |
Family Households | 842 | 13,241 | 35,462 | |
Non-Family Households | 419 | 6,536 | 19,023 | |
Married Couple | 533 | 8,789 | 23,349 | |
Other Family | 309 | 4,452 | 12,113 | |
Married w/Child | 279 | 4,459 | 11,707 | |
Single Male w/Child | 41 | 576 | 1,501 | |
Single Female w/Child | 161 | 1,892 | 4,887 |
Population Change Last Two Decades - Plus Projection
2000 | % | 2010 | % | 2020 | % | 2030 | |
---|---|---|---|---|---|---|---|
Tennessee | 5,689,283 | +12 | 6,346,105 | +9 | 6,886,369 | +7 | 7,393,069 |
Davidson County | 569,891 | +10 | 626,681 | +13 | 705,400 | +7 | 756,117 |
Rutherford County | 182,023 | +44 | 262,604 | +30 | 341,000 | +24 | 422,589 |
Williamson County | 126,638 | +45 | 183,182 | +33 | 244,052 | +25 | 304,687 |
Wilson County | 88,809 | +28 | 113,993 | +29 | 147,012 | +21 | 177,356 |
Total Working Age Population:
Total Households:
Total Working Age Population:
Total Households:
Total Working Age Population:
Total Households: